
Both the S&P Dow Jones Indices and home price indicators from the Federal Housing Finance Agency (for March continue to show slowing appreciation although there also continue to be significant regional differences.
The S&P CoreLogic Case-Shiller U.S. National Home Price NSA Index, covering all nine U.S census divisions, reported a 3.7 percent annual gain in March, down from 3.9 percent in the previous month. Before seasonal adjustment, the National Index posted a month-over-month increase of 0.6% in March, jumping from an 0.2 percent gain in February, but after seasonal adjustment, there was no change from the 0.3 percent increase posted in February.
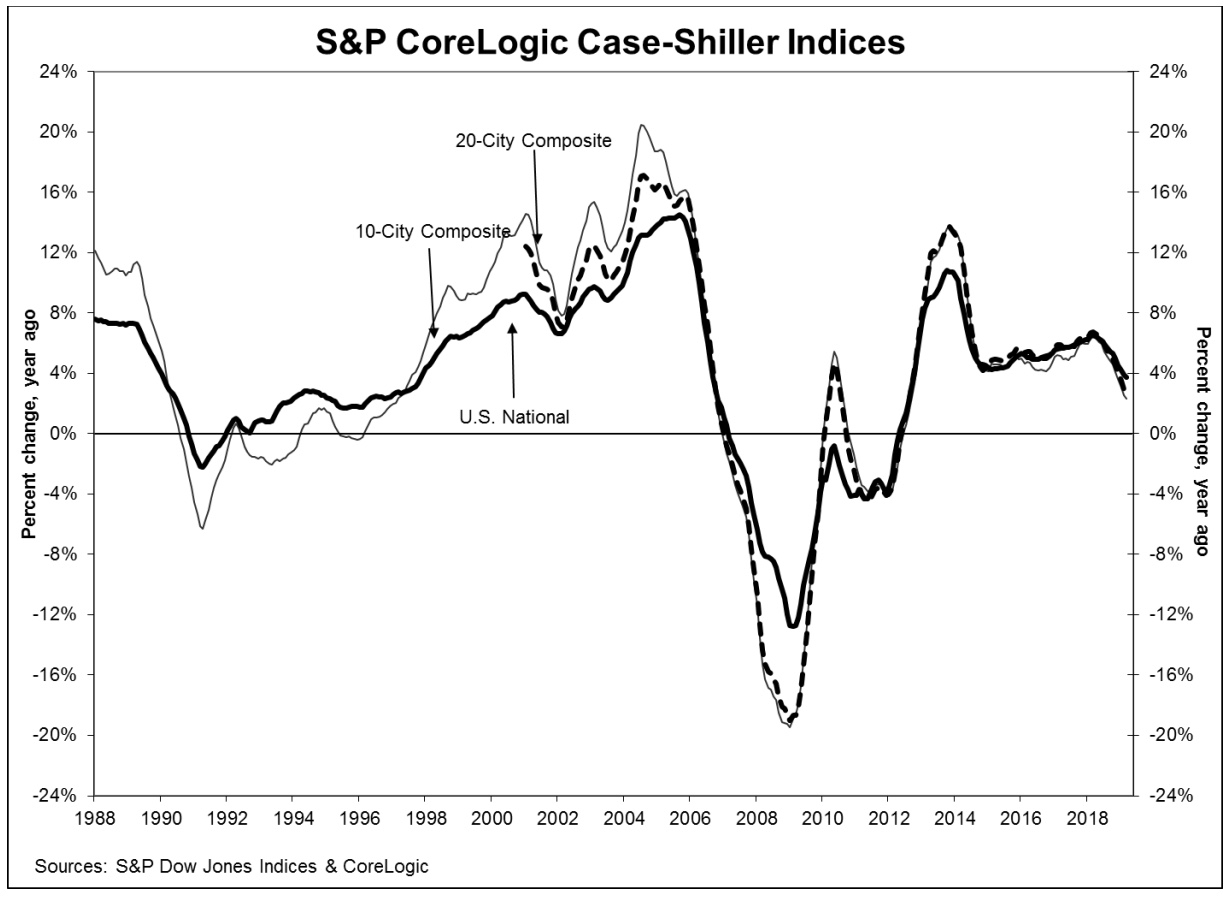
The annual increase in the 10-City Composite was 2.3 percent compared to 2.5 percent in March while the 20-City Composite increased 2.7 percent, down from a 3.0 percent rate of appreciation the prior month. Both composites posted identical month-over-month changes, 0.7 percent before seasonal adjustment and 0.1 percent afterward. Nineteen of 20 cities posted positive changes on an unadjusted basis and 14 of 20 cities after adjustment.
Las Vegas again posted the largest annual price appreciation at 8.2 percent. Phoenix followed at 6.1 percent. and Tampa was third at 5.3 percent. Four of the 20 cities had larger increases in the year ending March 2019 than in the year ending February 2019.
David M. Blitzer, Managing Director and Chairman of the Index Committee at S&P Dow Jones Indices provided the following analysis. "Home price gains continue to slow. The patterns seen in the last year or more continue: year-over-year price gains in most cities are consistently shrinking. Double-digit annual gains have vanished. The largest annual gain was 8.2 percent in Las Vegas; one year ago, Seattle had a 13 percent gain. In this report, Seattle prices are up only 1.6 percent. The 20-City Composite dropped from 6.7 percent to 2.7 percent annual gains over the last year as well. The shift to smaller price increases is broad-based and not limited to one or two cities where large price increases collapsed. Other housing statistics tell a similar story. Existing single-family home sales are flat. Since 2017, peak sales were in February 2018 at 5.1 million at annual rates; the weakest were 4.36 million in January 2019. The range was 650,000.
"Given the broader economic picture, housing should be doing better. Mortgage rates are at 4 percent for a 30-year fixed rate loan, unemployment is close to a 50-year low, low inflation and moderate increases in real incomes would be expected to support a strong housing market. Measures of household debt service do not reveal any problems and consumer sentiment surveys are upbeat. The difficulty facing housing may be too-high price increases. At the currently lower pace of home price increases, prices are rising almost twice as fast as inflation: in the last 12 months, the S&P Corelogic Case-Shiller National Index is up 3.7 percent, double the 1.9 percent inflation rate. Measured in real, inflation-adjusted terms, home prices today are rising at a 1.8 percent annual rate. This compares to a 1.2 percent real annual price increases in housing since 1975."
The National Index is now up 11.7 percent from its prior peak in 2007. The 10-City and 20-City Composites have surpassed their pre-recession peaks by 0.6 percent and 3.7 percent respectively.
FHFA's Housing Price Index (HPI) indicates slightly higher gains annual gains than the Case-Shiller indices; a 12-month increase of 5.1 percent. However, the February to March change was identical to those reported for the City Composites at 0.1 percent. FHFA also reported on first quarter 2019 prices and they were up 1.1 percent.
Among the nine census regions the Mountain Division performed best. Prices were up 7.2 percent year-over-year with a 1.7 percent increase in Q1. The weakest annual appreciation was in the formerly fast rising Pacific region which had only a 3.7 percent annual increase and no change month-over-month.
Home prices were up in all 50 states and the District of Columbia between the first quarters of 2018 and 2019. Idaho topped the list at 13.4 percent while Nevada and Utah followed at 10.6 percent and 8.9 percent respectively. Also, in the top five were Tennessee and Georgia. Gains were smallest in Maryland, Delaware, and Louisiana, all failing to top 1.0 percent. Home prices moved higher in 95 of the 100 largest metropolitan areas.
"House prices have risen consistently over the last 31 quarters," said Dr. William Doerner, Supervisory Economist. "Although price growth is still positive, the upward pace is softening across the country, especially among states with the largest supplies of housing."
The HPI is calculated using home sales price information from mortgages sold to, or guaranteed by, Fannie Mae and Freddie Mac. The index was benchmarked to 100 in January 1991. The March 2019 reading was 273.4
The S&P CoreLogic Case-Shiller Home Price Indices are constructed to accurately track the price path of typical single-family home pairs for thousands of individual houses from the available universe of arms-length sales data. The National U.S. Home Price Index tracks the value of single-family housing within the United States. The indices have a base value of 100 in January 2000; thus, for example, a current index value of 150 translates to a 50 percent appreciation rate since January 2000 for a typical home located within the subject market.
As of March 2019, the National Index was at 206.23, up from 205.04 in February. The 10- and 20-City Composites had readings of 227.57 and 214.09 respectively, compared to 226.20 and 212.70 the prior month. Los Angeles has the highest index at 281.63 and Cleveland the lowest at 122.28.


