The month of March nearly always sees a significant decline in the national delinquency rate. The average March decrease during this century has been just under 11.0 percent. Black Knight has speculated in the past that this is likely because the receipt of tax refunds allows delinquent borrowers to catch up on their mortgage payments. However, this March the correction was, in the words of the company, "eye-catching."
Black Knight's Mortgage Monitor, covering loan performance details for the month, notes that overall delinquencies dropped 13.2 percent, the largest change since the recovery began. Approximately 569,000 borrowers paid themselves current from some stage of delinquency or foreclosure and 52,000 of those came current from being 90 days or more past due, although not in active foreclosure. This was the highest such cure volume in more than three years.
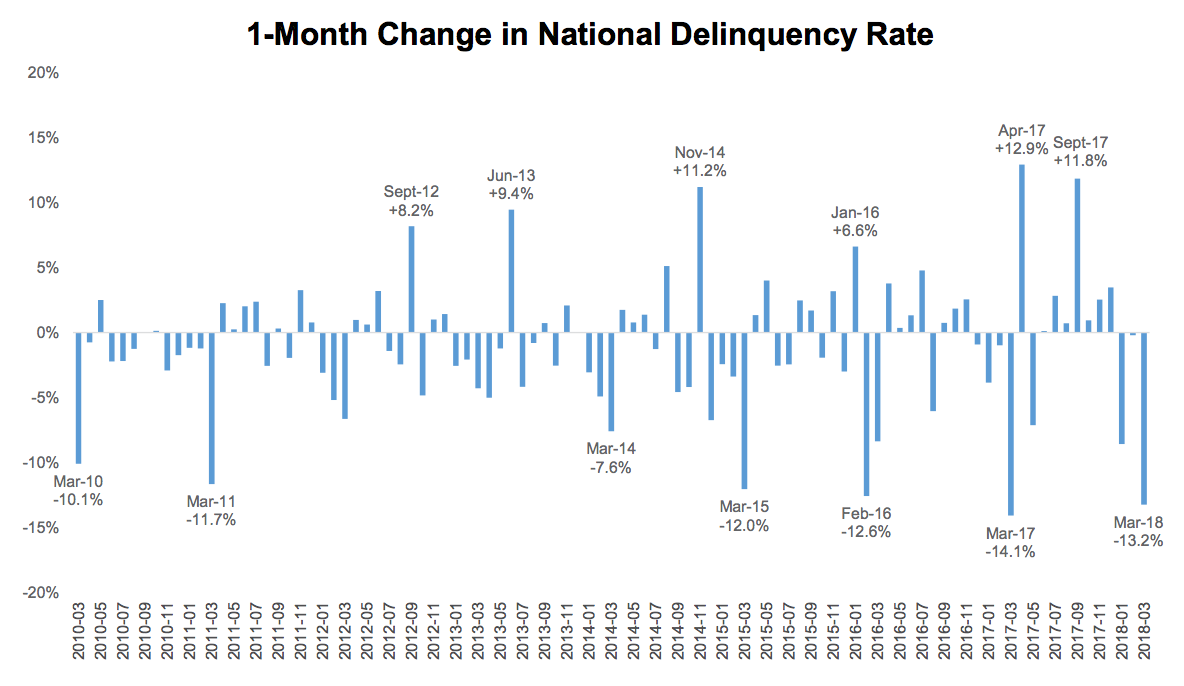
Historically FHA/VA and the GSEs, Freddie Mac and Fannie Mae, benefit the most form the March phenomenon, and that was true this year as well. Rates fell 17 percent for lender groups. Portfolio lenders saw a 10 percent decrease and private lenders 8 percent.
In related delinquency news, the Monitor notes that over the five years preceding last fall's twin hurricanes Texas and Florida accounted for 15 percent of all mortgage defaults. After the storms, missing payments spiked from 51,000 in the third quarter of 2017 to 184,000 in the fourth. Default activity remained elevated in January and February, but as of March non-current loans in the two states fell to 14,400, only 1,000 above their long-term (2000-2005) March averages.
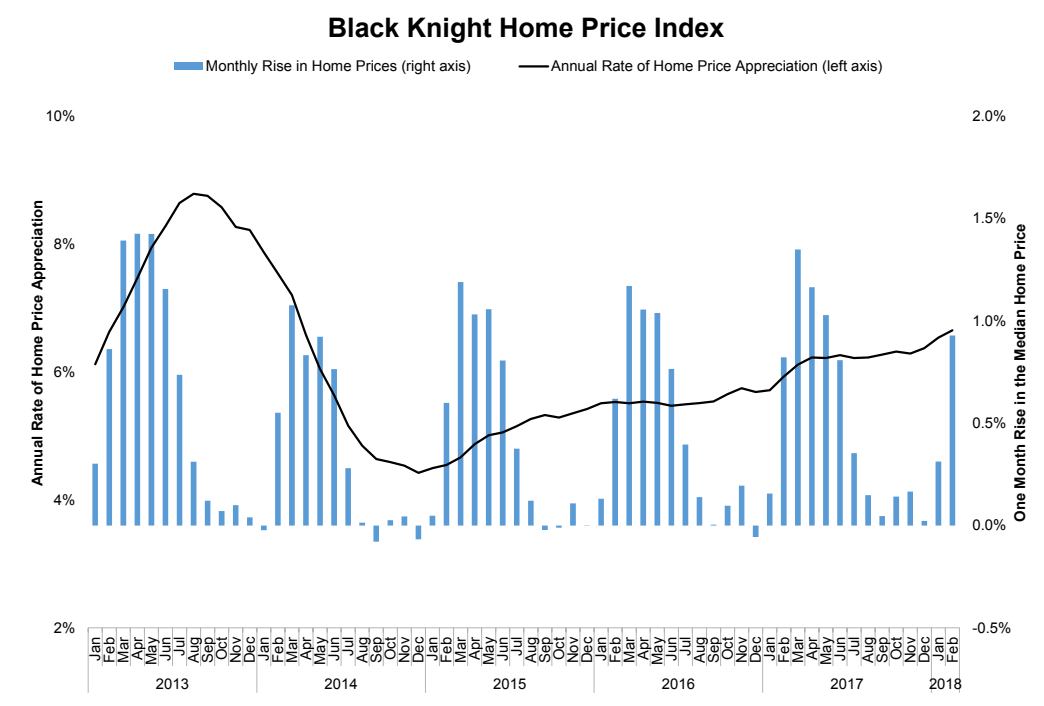
Black Knight also found that home prices in 2018 had the strongest gains at the start than in any year since 2005. Ninety-eight percent of the largest real estate markets in the county and 97 percent of the Core Based Statistical areas tracked by the company pasted annual increases, with the Western United States seeing some of the greatest gains.
As Black Knight Data & Analytics Executive Vice President Ben Graboske explained, "At the national level, home prices rose 1.24 percent since the start of 2018, with both January and February having their strongest respective single-month growth rates in 13 years. As of the end of February, home prices had risen 6.65 percent from a year ago, a metric that continues to increase. The rate of appreciation has accelerated by 42 basis points over the past six months and by 72 basis points over the past 12 months. This acceleration, combined with a nearly 40 basis point increase in the prevailing 30-year fixed interest rate during that same time frame, is creating a tighter affordability climate. We have now seen monthly increases in the national median home price for 27 of the past 28 months, and annual gains for 70 consecutive months.
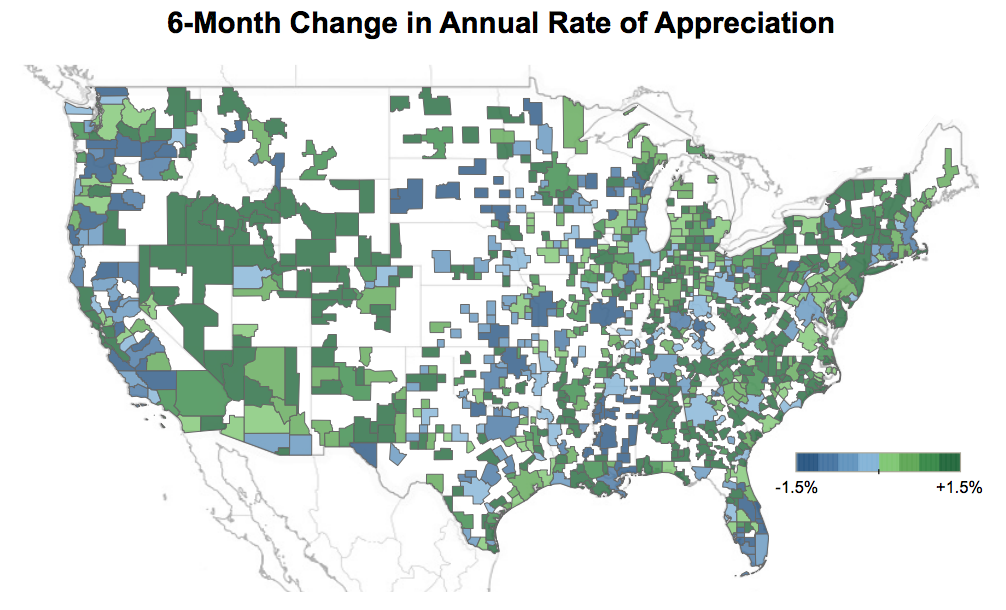
All the 11 markets with price gains of 10 percent or more are in the western United States. However, nationally there is an approximate 60-40 split in the number of markets experiencing appreciation vs. those with some degree of deceleration.
The markets that are still accelerating the most rapidly are San Jose and Las Vegas. The Silicon Valley city has seen its rate of appreciation accelerate from just under 6 percent at the start of 2017 to a 24.1 percent annual increase in February. The median home price in San Jose is $1.17 million, up by $226,000 from one year earlier. The Monitor vividly illustrates the magnitude of that gain; more than half the country's 100 largest markets have median prices smaller than that $226,000 annual increase.
Las Vegas, which was the epicenter of the foreclosure crisis less than a decade ago, has now surpassed Seattle as the second fastest-appreciating market. Home prices are up nearly 15 percent from last year. Even so, Las Vegas home prices remain 22 percent below their pre-recession peak."
The Rocky Mountain region (Utah, Idaho, Colorado and parts of Arizona and New Mexico) also sees prices appreciating as is a broad swath of the Northeast. Markets that are cooling are in the central part of the country and down into portions of Florida. Some areas in the west are also slowing a bit.
Prices at the low end of the market continues to have the highest rate of increase, an annual change of 8.4 percent, more than 25 percent greater than the national average, but that growth is slowing. In the last six months the bottom price tier has decelerated by 18 basis point while the national rate picked up by 42 basis points. Meanwhile, the appreciation rate among the highest-priced homes has picked up speed, increasing by 150 basis points. On an annual basis that tier has moved from a lackluster 3.0 percent rate of increase to 5.6 percent.
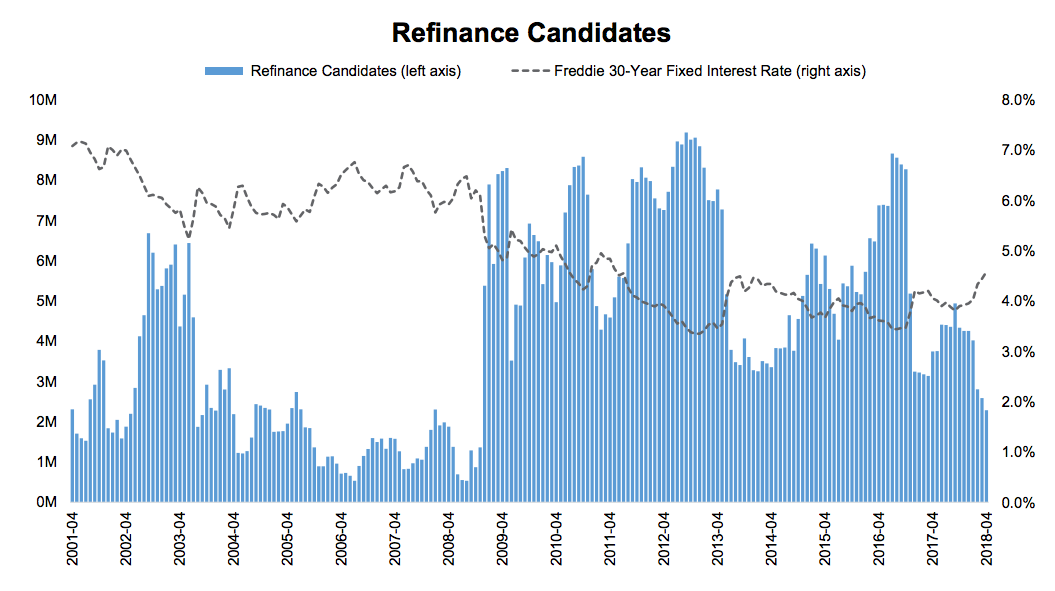
The Monitor's data for March also shows the continued impact of rising mortgage interest rates on the population of borrowers who could both likely qualify for and gain a rate benefit from refinancing. As of the final full week in April fixed-rates had rising to 4.58 percent, tied with August 2014 for the highest rate since July 2011.
There are now nearly 2 million fewer refinance candidates than there were entering 2018, a 46 percent decline. The total number of refinance candidates now stands at 2.3 million, the fewest since November 2008, when interest rates were above 6.0 percent. Additionally, the incentive for borrowers to refinance to lower their interest rates is all but non-existent among mortgages originated in the past five years. Of the nearly 28 million borrowers with 30-year mortgages originated in 2012 or later, fewer than 45,000 have 75 basis points of interest rate incentive to refinance while also meeting broad-based eligibility requirements. This makes it likely that cash-out activity (which has also slowed) will dominate refinance originations in upcoming months.