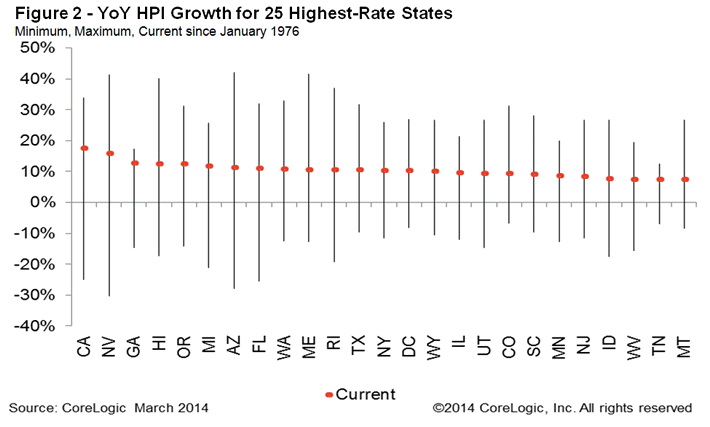
Home prices posted another double digit annual increase in March CoreLogic said today. The company's Home Price Index (HPI) including distressed sales rose 11.1 percent compared to the HPI in March 2013 and was up 1.4 percent from February. This was the 25th consecutive month in which prices have increased compared to the same month one year earlier and the 13th month in which those gains have exceeded 10 percent.
The index excluding distressed sales which include short sales and sales of lender-owned real estate (REO) was up 9.5 percent from one year earlier. On a month-over-month basis the index rose 0.9 percent.
California had the largest gain on both the index including and the one excluding distressed sales, posting 17.2 percent growth on the first and a 13.2 percent increase on the second. Nevada's followed on both scales with price gains of 15.5 percent and 11.8 percent respectively. Other large movers on the distressed index were Georgia (+12.4 percent), Hawaii (+12.3 percent, and Oregon (+12.2 percent). The remainder of the top five on the HPI scale excluding distressed sales were Florida (+10.9 percent), Maine and Hawaii (+10.6 percent each).
Arkansas was the only state where the HPI including distressed sales posted a loss, falling 0.3 percent. Ninety-eight of the top 100 Core Based Statistical Areas showed year-over-year increases in their HPI. The exceptions were Little Rock-North Little Rock-Conway, Ark., and Rochester, N.Y.
Colorado, the District of Columbia, North Dakota, South Dakota, Texas, and Wyoming all set new price peaks during the month. Including distressed transactions, the peak-to-current change (April 2006 to March 2014) in the national HPI including distressed sales was -16.0 percent in March and excluding distressed sales it was -11.6 percent. Twenty-three states and the District of Columbia are at or within 10 percent of their peak price.

CoreLogic is forecasting that its HPI including distressed sales will increase 0.8 percent from March to April and 6.7 percent from March 2014 to March 2015. The index excluding those sales is projected to rise 0.6 percent from March to April and 5.7 percent over the 12 months ending in March 2015.
"March data on new and existing home sales was weaker than expected and is a cause for concern as we enter the spring buying season," said Dr. Mark Fleming, chief economist for CoreLogic. "Interest rate-disenfranchised potential sellers are adding to the existing shadow inventory, while buyers who can't find what they want to buy are on the sidelines creating a new kind of 'shadow demand.' This supply and demand imbalance continues to drive home prices higher, even though transaction volumes are lower than expected."
"Home prices continue to rise across the nation, but affordability, tight credit and supply concerns are becoming an increasing drag on purchase market activity," said Anand Nallathambi, president and CEO of CoreLogic. "In many markets - especially major metro areas like Los Angeles, Atlanta and New York - home prices are being driven up at double-digit rates fueled by a lack of inventory and record levels of cash purchases."


