
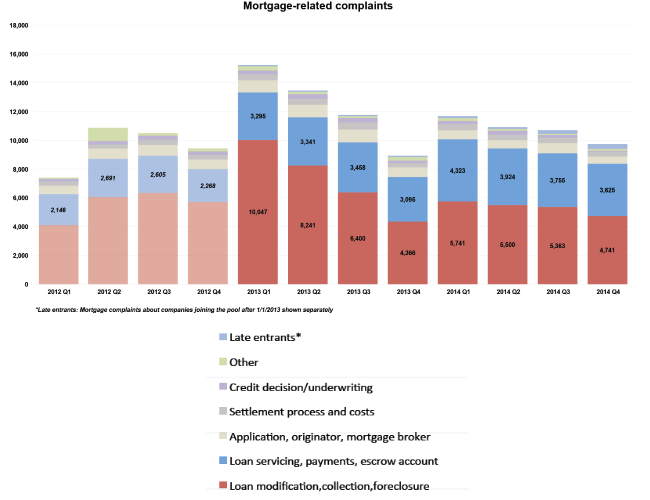
Black Knight's Mortgage Monitor report for May took a close look at complaint trends lodged with the Consumer Financial Protection Agency (CFPB). Along with the Five Star Institute, Black Knight compared complaints with corresponding mortgage servicing volume from the first quarter of 2013 to the fourth quarter of 2014.
The analysis found that mortgage-related complaints to CFPB peaked in the first quarter of 2013 at a little under 16,000 and have been trending downward over the past 48 months. They have generally observed a seasonal pattern, increasing in the first quarter of each year and then declining through the next three.
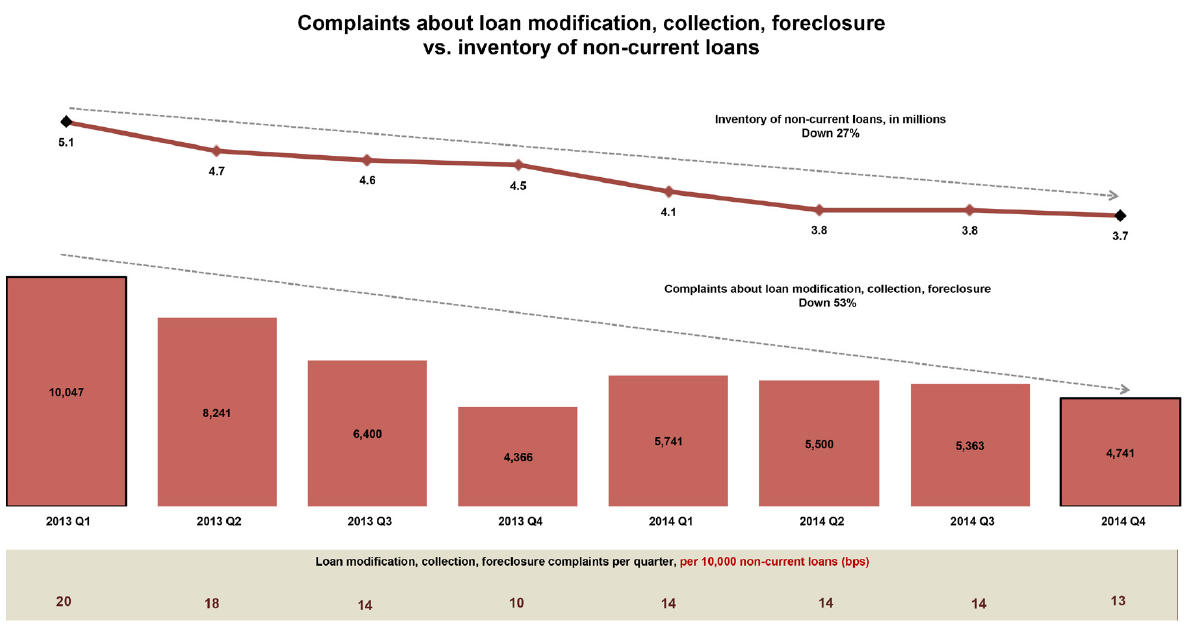
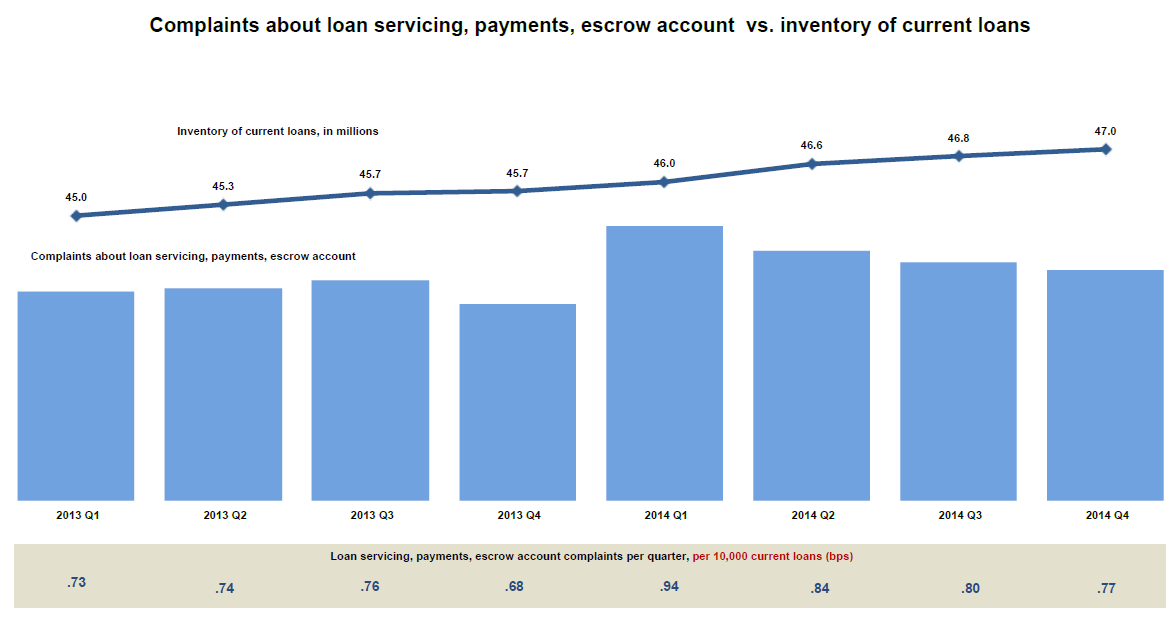
The analysis focused on two servicing categories; loan servicing which includes payments and escrow account complaints and loan modification, collection and foreclosure complaints. The first set were compared to the inventory of current loans over time and the second set were compared against the inventory of non-current loans. That latter group make up the bulk of all complaints.
Since the first quarter of 2013 the inventory of current loans has increased from 45 million borrowers to 47 million in the Q4 of 2014. At the same time loans 30 or more days past due has dropped from 5.1 million to 3.7 million. While that is a 27 percent decrease, the number of modification, collection, and foreclosure related complains has dropped by 53 percent over the same period. In the last quarter analyzed there were approimately13 delinquency related complains per 10,000 loans.
Loan servicing, escrow, and payment related complaints have held relatively stable as compared to the inventory of current loans since the first quarter of 2013 - less than one complaint per 10,000 loans.
Black Knight said the spike in complaints seen in Q1 2014 (which, from the chart regarding mortgage related complaints above could as easily be viewed as an atypical decline in the four quarter of 2013) was broad-based and spread across all sizes of servicers. It could potentially indicate more of a result of CFPB's media efforts than discrete servicer action.
The Monitor also looked at negative equity, finding that over the last year the number of underwater borrower has decreased by 1.6 million. Twenty-nine percent of underwater borrowers are seriously delinquent on their mortgages and borrowers in negative equity positions make up 77 percent of all active foreclosures. In fact, the company said, one of every three borrowers in active foreclosure has a current loan-to-value ratio of 150 or more, meaning they owe 50 percent more than their homes are worth. 72 percent of those 90 or more days past due are also underwater
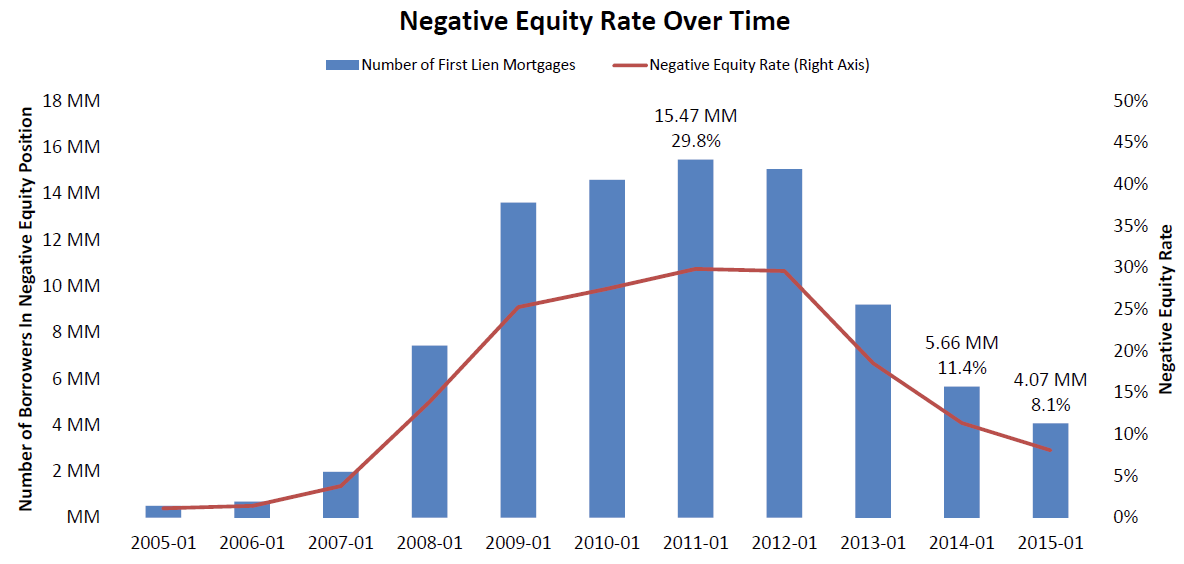
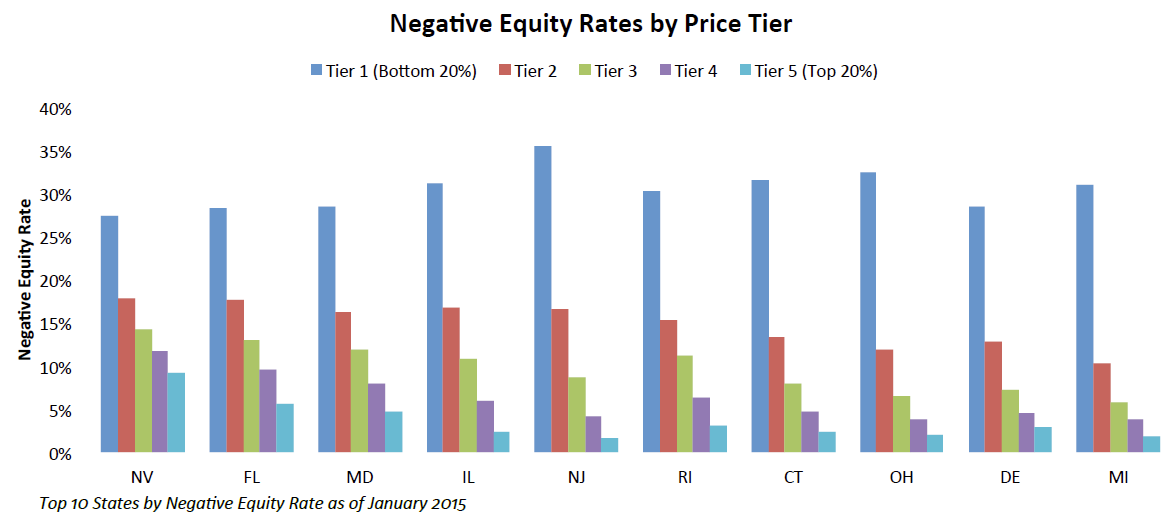
Black Knight tracks its home value estimates separately, using one home price estimate for all mortgages and another which excludes distressed properties. Its senior vice president of Data and Analytics, Ben Graboske said the company has the benefit of knowing current unpaid balances on millions of first lien mortgages every month and is also able to separately and distinctly value distressed and non-distressed properties down to the ZIP code level. This allows them to determine equity positions, especially in heavily distressed communities. The trend, Graboske said, is one of overall improvement though negative equity distribution varies considerably depending upon geographical location and home values within a given market.
"We drilled down to take a closer look at how this was playing out geographically and among different property price tiers. Nevada and Florida continue to see the nation's highest negative equity rates, with 16.4 and 15.1 percent of borrowers being underwater in those states, respectively." He continued, "In terms of price tiers, we found that the bottom 20 percent of homes by price continue to struggle with negative equity, while negative equity rates on high-end homes - the top 20 percent by price - are limited, even in the hardest hit states. In fact, when reviewing at the state level, borrowers in the bottom 20 percent of homes by price are nine times more likely to be underwater on their mortgages than those in the top 20 percent."
The Monitor also said that the drop in the mortgage delinquency rate in March was the largest monthly decline in nine years - 12.2 percent - and declines were seen across all stages of delinquencies with the 30-day bucket hitting the lowest level in over 10 years. For every 10,000 loans that were current at the end of February, only 73 borrowers missed a payment in March, marking the lowest current-to-30 roll rate in over 15 years. Roll rates from 30-to-60 and 60-to-90 days delinquent hit their lowest levels since March 2006. Finally, the rate of loans curing from 30-days delinquent to current status was 40.7 percent, the highest level since March 2005 and slightly above the 2000-2005 average of 40.4 percent.


