
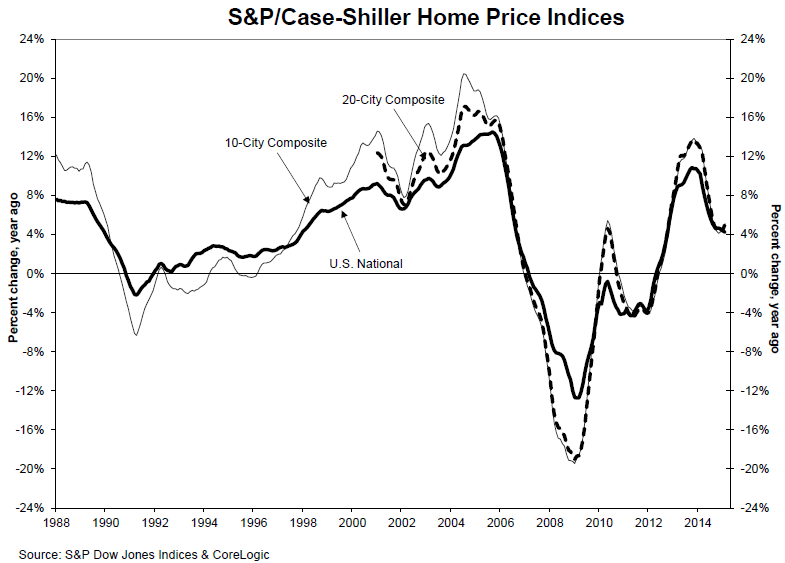
S&P Dow Jones called February increases as measured by its Case-Shiller Home Price Indices "widespread." The National Home Price Index which covers all nine U.S. Census division was 4.2 percent higher than a year earlier, slightly less than the 4.5 percent annual increase posted in January, but both the 10-City and 20-City Composites posted higher annual gains.
The 10-Ciity Composite was up 4.8 percent compared to February 2014 and the 20-City Composite rose 5.0 percent. The two indices had posted annual increases of 4.3 percent and 4.5 percent respectively in January.
Denver had the highest annual increase at 10.0 percent, its first double-digit gain since August 2013 and San Francisco's number was up 9.8 percent from a year earlier. Seventeen cities had higher annual increases than in January but in San Diego, Las Vegas, and Portland, Oregon the pace of 12 month changes slowed.
On a month-over-month basis the National Index was up a slight 0.1 percent but both city measures had "significant" gains of 0.5 percent, the largest monthly positive changes for each since July 2014. Sixteen of the 20 cities reported upticks for the month but Cleveland, Las Vegas, and Boston fell 1.0, 0.3, and 0.2 percent respectively. Chicago's level was unchanged.
David M. Blitzer Managing Director and Chairman of S&P's Index Committee said, "Home prices continue to rise and outpace both inflation and wage gains. The S&P/Case-Shiller National Index has seen 34 consecutive months with positive year-over-year gains; all 20 cities have shown year-over-year gains every month since the end of 2012. While prices are certainly rebounding, only two cities - Denver and Dallas - have surpassed their housing boom peaks. Nationally, prices are almost 10% below the high set in July 2006. Las Vegas fell 61.7% peak to trough and has the farthest to go to set a new high; it is 41.5% below its high. If a complete recovery means new highs all around, we're not there yet.
"A better sense of where home prices are can be seen by starting in January 2000, before the housing boom accelerated, and looking at real or inflation adjusted numbers. Based on the S&P/Case-Shiller National Home Price Index, prices rose 66.8% before adjusting for inflation from January 2000 to February 2015; adjusted for inflation, this is 27.9% or a 1.7% annual rate. The highest price gain over the last 15 years was in Los Angeles with a 4.3% real annual rate; the lowest was Detroit with a -3.6% real annual rate. While nationally, prices are recovering, new construction of single family homes remains very weak despite low vacancy rates among both renters and owner-occupied homes."
As of February average home prices for the 20 cities included in the two composite indices are back to autumn 2004 levels but remain 15-17 percent below their June/July 2006 peaks. Since hitting their March 2012 cities in the 10-City Composite have recovered by 28.8 percent and prices in those cities in the 20-City Composite have climbed 29.5 percent.
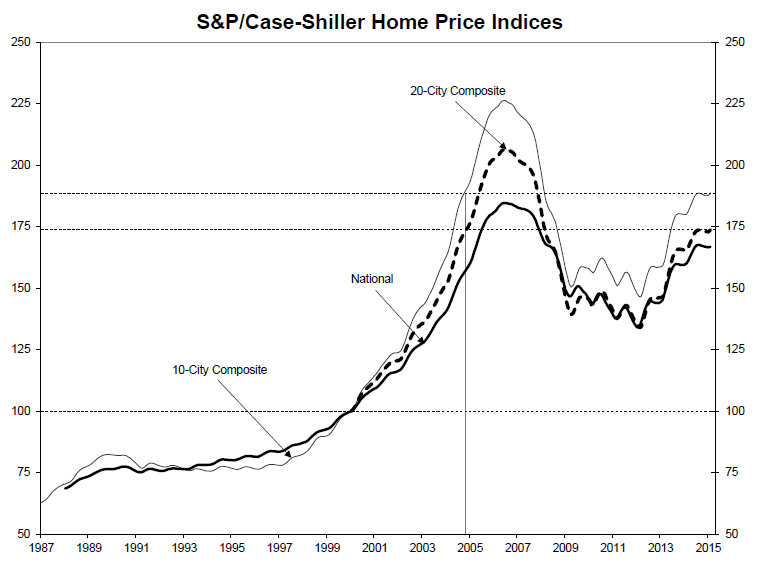
The Case-Shiller Indices are constructed to track the price path of typical single-family homes located in each of the 20 metropolitan areas. Each index combines matched price pairs for thousands of individual houses from the available universe of arms-length sales data. The National HPI tracks the value of single-family housing within the U.S. The indices have a base value of 100 in January 2000, thus Detroit's current value of 96.88 means values there are at 96.88 percent of its January 2000 base while prices in Los Angeles with an index of 227.68 have more than doubled in that time frame.


