
A month after interest rates began to rise, neither the S&P CoreLogic Case-Shiller indices nor that from the Federal Housing Finance Agency (FHFA) found any slowdown in home price appreciation. Both logged double digit annual increases, in all cases higher than those in January.
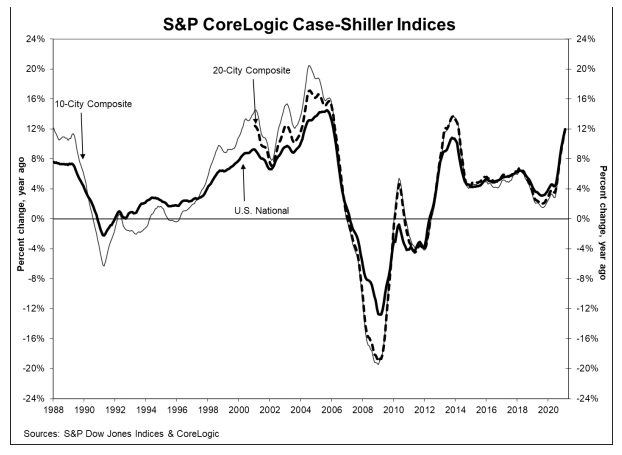
The Case-Shiller National Home Price Index, which covers all nine U.S. census divisions, rose 12.0 percent in February compared to an annual increase of 11.2 percent in January. On a month-over-month basis the National Index was up 1.1 percent before and after seasonal adjustment.
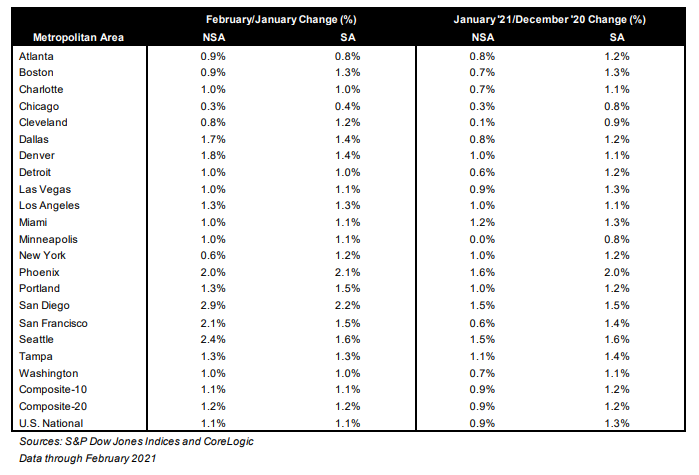
The 10-City Composite Index gained 11.7 percent and the 20-City index was 11.9 percent higher than a year earlier. The annual increases in the two composites in January were 10.9 percent and 11.1 percent, respectively. the 10-City and 20-City Composites posted increases of 1.1 percent and 1.2 percent respectively from January for both their adjusted and non-adjusted indices.
Phoenix's appreciation was again the highest among all 20 metro areas, 17.4 percent annual growth. San Diego followed closely at 17.0 percent and Seattle prices rose 15.4 percent. Nineteen of the 20 cities reported higher increases in the year ending February 2021 versus the year ending January 2021.
"The S&P CoreLogic Case-Shiller Index continued to speed ahead, jumping 12 percent in February," Selma Hepp, CoreLogic Deputy Chief Economist noted. "With national and city-composite indices, as well as all three price tiers surging at double-digit rates for the third consecutive month, the housing market is running full steam ahead -- with many observers questioning where the train is heading and what the next stop will look like. Nevertheless, while the sustainability question is reasonable, housing market strength is reflecting many of the positive and continually improving signs of the economic recovery, including employment gains, consumer savings and more purchase power among home buyers, all while mortgage rates remain historically low. More for-sale inventories and a narrowing pool of potential buyers will likely slow the speeding train, providing a clearer vision of what's ahead."
Craig Lazzara, Managing Director and Global Head of Index Investment Strategy at S&P said February was the ninth straight month of accelerating prices in the National Index, an acceleration reflected in the 10- and 20-City Composites as well. "More than 30 years of S&P CoreLogic Case-Shiller data help us to put February's results into historical context, Lazzara said. "The National Composite's 12.0 percent gain is the highest recorded since February 2006, exactly 15 years ago, and lies comfortably in the top decile of historical performance. Housing's strength is reflected across all 20 cities; February's price gains in every city are above that city's median level, and rank in the top quartile of all reports in 18 cities.
"These data remain consistent with the hypothesis that COVID has encouraged potential buyers to move from urban apartments to suburban homes. This demand may represent buyers who accelerated purchases that would have happened anyway over the next several years. Alternatively, there may have been a secular change in preferences, leading to a permanent shift in the demand curve for housing. Future data will be required to analyze this question.
"Phoenix's 17.4 percent increase led all cities for the 21st consecutive month, with San Diego and
Seattle close behind. Although prices were strongest in the West (+13.0 percent) and Southwest (+12.9 percent), every region logged double-digit gains."
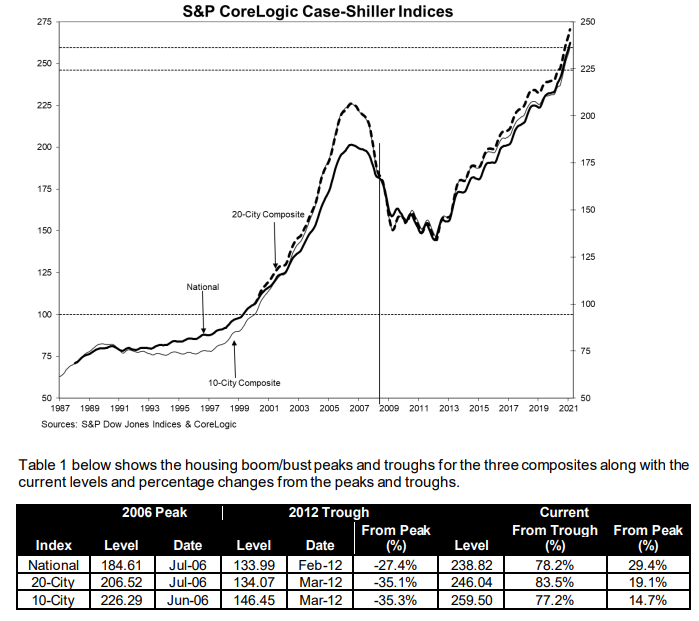
The S&P CoreLogic Case-Shiller Home Price Indices are constructed to accurately track the price path of typical single-family home pairs for thousands of individual houses from the available universe of arms-length sales data. The National U.S. Home Price Index tracks the value of single-family housing within the United States. The indices have a base value of 100 in January 2000; thus, for example, a current index value of 150 translates to a 50 percent appreciation rate since January 2000 for a typical home located within the subject market.
As of January 2021, the National Index was at 238.83 compared to 236.31 in January. The 10- and 20-CityComposites had readings of 259.50 and 246.04, up from to 256.50 and 242.98 the prior month. Los Angeles has the highest index reading at 325.33 . Cleveland remains at the bottom of the index at 142.62, but only fractionally below the Detroit reading of 142.63.
FHFA puts the annual increase in its Housing Price Index (HPI) at 12.2 percent in February. The January rate was 12.0 percent. Acceleration slowed ever so slightly month-over-month, from a 1.0 percent gain in January to 0.9 percent in February. The index is now 42 percent higher than its previous peak in April 2007.
For the nine census divisions, seasonally adjusted monthly house price changes from January 2021 to February 2021 ranged from an 0.3 percent increase in the Middle Atlantic division to 1.6 percent in the Mountain division. The 12-month changes, all in double digits, ranged from 10.5 percent in the West North Central division to 15.4 percent in the Mountain division.
"Annual house price growth achieved a new record high in February" said Dr. Lynn Fisher, FHFA's Deputy Director of the Division of Research and Statistics. "The 12.2 percent gain represents an increase of $35,000 for a median-priced home that sold a year ago at $290,000 in the Enterprises' data."
FHFA's HPI reflects the sales prices of homes sold during the month and financed by one of the government sponsored enterprises Fannie Mae or Freddie Mac. The index was benchmarked at 100 in January 1991. The current reading is 319.7.


