
Was the dramatic deleveraging of American households during the financial crisis solely the result of charge offs and defaults or were there other factors at play? The Federal Reserve of New York recently looked at trends in consumer debt before and after the Great Recession.
Financial Crisis at the Kitchen Table: Trends in Household Debt and Credit, written by Meta Brown, Andrew Haughwout, Donghoon Lee, and Wilbert van der Klaauw and published in Current Issues in Economics and Finance, is based on data from the Feds Consumer Credit Panel which represents a 5 percent random sample of U.S. individuals and members of their household with credit files - in total about 15 percent of the population. The study used information from the credit reports of these individuals for each quarter over the last thirteen years, up to September 2012.
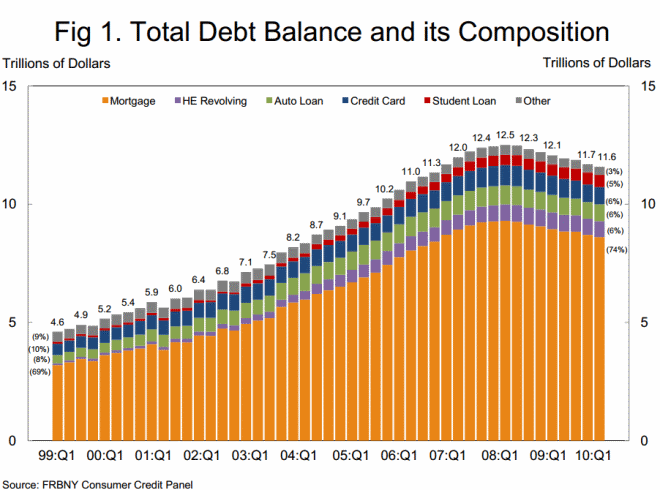
The Federal Reserve System's Flow of Funds Accounts show there was a steep run-up in consumer debt starting in 1999. On March 31 of that year consumers owed about $4.6 trillion to creditors but over the next nine years that rose more than 170 percent, reaching $12.7 trillion at the end of the third quarter of 2008. Driving this growth was an increase in residential real estate debt which almost always accounts for 70 percent of household liabilities. Amounts owned on installment mortgages and home equity lines of credit (HELOCs) tripled over this period, from $3.3 trillion to $10 trillion. At the same time other types of consumer debt nearly doubled, going from $1.4 trillion to $2.7 trillion.
The study found many factors accounted for this increase including rising populations, rising incomes and stock prices, rising house prices, falling interest rates, and the "democratization" of credit. During this period assets were growing as well so consumers' net wealth grew steadily over the period.
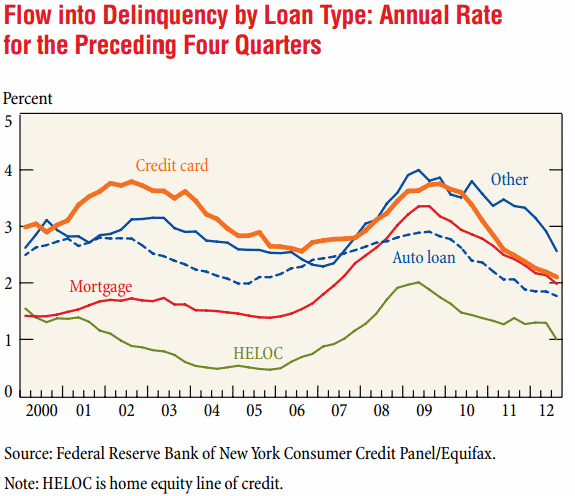
Delinquencies remained stable during the 1999 to 2006 period at about 4 percent of outstanding debt 30 or more days past due and 2 percent over 90 days delinquent. Then rates rose quickly during 2007 and 2008 reaching a peak of 30+ day rate of 6.7 percent at the peak of debt in Q3 2008.
Since then U.S. consumers have reduced their debt, according to data from the Panel from an aggregate of $12.7 trillion to $11.3 trillion or a decrease of $1.4 trillion by the end of Q3 2012. Total debt has decreased roughly 11 percent from the peak with mortgage related debt now accounting for 76 percent; the remainder is comprised of credit cards, auto loans, student loans, and other consumer debt. The Flow of Funds Accounts reflect a slightly lower decline in debt, slightly more than $960 billion, but both sources indicate steep declines in 2009.
Even after debt peaked delinquencies continued to climb, reaching a maximum level of 11.9 percent in the fourth quarter of 2009 (severe delinquency peaked in Q1 2010 at 8.7 percent). Both measures of delinquency declined decisively from their peaks to 8.9 percent and 6.6 percent respectively in the third quarter of 2012, the most recent date of available data.
The "flow into delinquency" measures debt balances that were previously current but became delinquent in each quarter. Debt performance deteriorated across all debt types but it started with installment mortgage debt (excluding HELOCS). Between Q4 2005 and Q4 2008 new installment mortgage delinquencies tripled from $98 billion to more the $310 billion then slowed steadily. New mortgage delinquencies reached a recent low of $140 billion in Q3 2012.
At least three major mechanisms account for the recent decline in consumer debt:
1. Declining consumer use of and demand for credit;
2. Declining lender supply of credit;
3. An increasing amount of nonperforming debt written off by lenders.
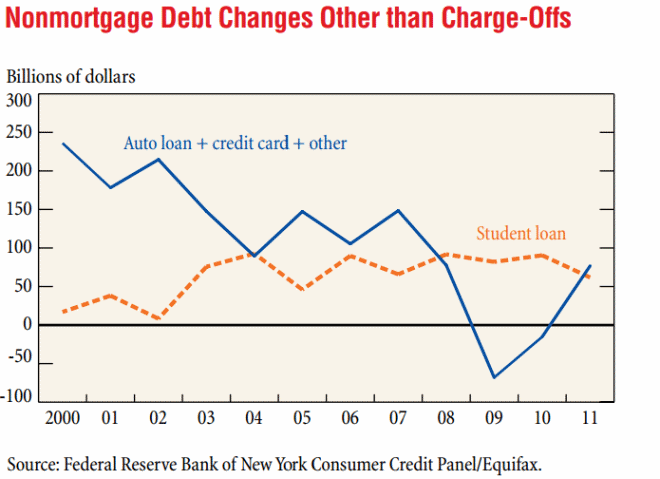
If charge-offs explain the entire reduction in debt there is little need to understand the role played by the other two, but when charge-offs are stripped out of non-mortgage debt and that debt is broken into two parts - student loans and all other loans - the study found that up to 2009 consumers were increasing both of these nonmortgage debt types each year. In 2009 and 2010 the "other" component became negative ($68 billion and $15 billion respectively) but student debt continued to grow.
Accounting for mortgage debt is more complicated because after a charge-off and foreclosure there is a house to be resold to another party who may take on a mortgage thus reducing the net debt reduction from the charge-off. This prevented the study's authors from allocating mortgage debt decline to net charge-offs or changes in active borrowing and repayment. Instead they focused on behavior by dividing the change in mortgage balances into three components:
1. Changes related to housing transactions (payoffs, new mortgages). This component fell sharply as the value of housing transactions declined. In this component the authors excluded the effects of charge-offs.
2. Negative contributions of charge-offs. Here is clear evidence of the foreclosure crisis with charge-offs totaling around $1.3 trillion from 2007 through 2011.
3. Cash-out refinances of first liens, changes in junior-lien balances, and regular amortization of first lien balances.
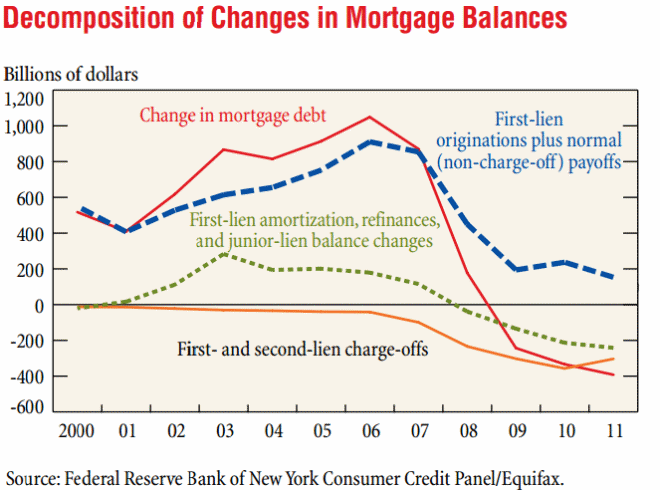
While amortization reduces balances at a fairly steady pace, the other components have declined sharply since 2007. This is interpreted as indicative of consumer responses to economic and financial conditions. From 2000 to 2007 they extracted equity and increased mortgage debt by an average of $135 billion per year; in 2008 this component turned negative and reached -$214 billion in 2011.
Taken together the information on mortgage and nonmortgage debt indicate major changes in consumer behavior other than delinquency and default. Borrowing contributed an annual average of about $350 billion to consumers' cash flows between 2000 and 2007, by 2010 consumers reduced their cash flows by $138 billion to reduce the debt, a net change of -$500 billion in just three years.
The remaining issue is whether this debt reduction was voluntary or if consumers were forced to pay down debt as credit standards tightened. The study found the following:
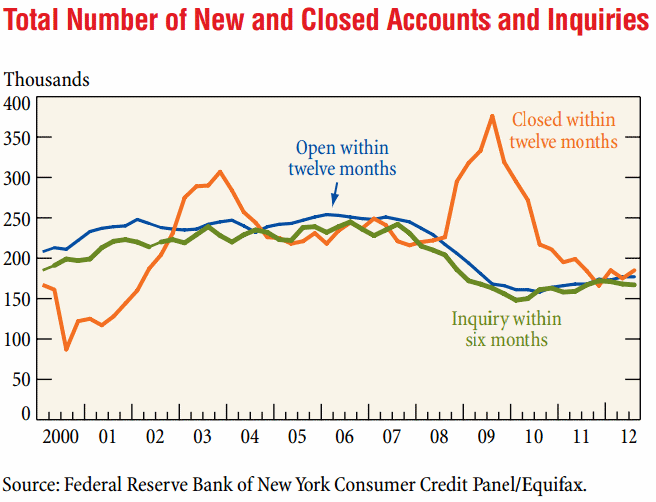
- There was a substantial decrease in the number of open credit accounts, especially credit cards after the 2008 peak. Credit card accounts dropped by 120 million between Q2 2008 and Q3 2010.
- The number of installment and revolving credit accounts opened was high and flat during the middle of the 2000 decade but then began a decline in early 2008 that extended through Q3 2010, falling by 40 percent to 158 million. Since then account openings have increased modestly to 177 million, well below the peak.
- To determine if the decline in new accounts was attributable to tighter lending standards or lower consumer demand the authors looked at account inquiries and found significant declines, concluding that fewer applications for credit contributed to the decline in account openings.
- Account closings have rising since 1999 although not steadily. From third quarter 2008 to third quarter 2009 they underwent a sudden, steep increase from 226 to a peak of 376 million then moderated to 185 million. So at a time when new account openings were down, accounts were being closed in record numbers, however it is unclear whether borrowers or creditors were closing these accounts. There is separate information that large banks closed large number of accounts in 2009, particularly inactive or troubled ones.
- There were steep decreases in borrowing limits on credit card accounts (almost entirely lender driven) while at the same time utilization of HELOC balances increased by 5 percentage points.
The authors conclude that the decline in consumer debt is temporally correlated with the very rapid rise in unemployment rates in the second half of 2008. Households may choose to build their precautionary savings or increase their available credit to insure cash flows against job loss. This action would tend to reduce debt balances outstanding. Households may also use credit accounts to smooth their consumption, leading to more borrowing. While both types of behavior were present, the overall decrease in debt would suggest the precautionary behavior dominated.
From the asset side of the balance sheet, an important consequence of the initial increase and then drop in home prices is the dramatic fall in home equity. Given that the recent decline in housing prices is unprecedented in recent years there is little evidence of the effect of such large declines in housing wealth on the demand for debt. However, if a large decline in net worth can, in fact be expected to increase the marginal value of net savings, then this drop in equity may have induced net savings via reduction of mortgage debt along with other methods.
The question remains whether, in light of recent improvements in credit availability, how much further voluntary debt reduction will go before consumers begin to spend again. While debt pay-down has helped improve household balance sheets it has likely also contributed to slow consumption growth since the beginning of the recession. Thus the trajectory of debt has important implications for economic growth going forward.


