
A second company has now reported a recent increase in the number of underwater residential properties in the U.S. Last month Corelogic said that approximately 172,000 homes slipped from positive to negative equity in the fourth quarter of 2014, a change the company called "seasonal." Today RealtyTrac reported an increase in the first quarter of 2015 of 0.4 percent in the number of properties with negative equity, the first increase in nearly three years. Both reports noted year-over-year declines in underwater properties for the respective quarters.
In its U.S. Home Equity & Underwater Report for the first quarter RealtyTrac estimated a total of 7,341,922 properties were seriously underwater, i.e. the combined loan amount secured by the property is at least 25 percent higher than the property's estimated market value - representing 13.2 percent of all properties with a mortgage. The increase, while slight, was the first uptick since the second quarter of 2012. The number of underwater homes was down 4 percentage points from the first quarter of 2014.

RealtyTrac vice president Daren Blomquist indicated that the change was partially statistical, the result of homeowners cashing out equity. "At the end of 2014 we saw the lowest share of seriously underwater properties since we began tracking such data, but in the first quarter that share bumped up slightly as home price appreciation continued to slow down in many markets," Blomquist said. "In addition, the data indicates more owners who have regained equity listed and sold their homes in the first quarter, cashing out on some of the home equity on the table in the U.S. housing market. The biggest change in the equity landscape nationwide was in the category of homeowners with between 20 and 50 percent equity, which saw a net decrease of nearly half a million between the end of the fourth quarter and the end of the first quarter.
"Meanwhile most of the seriously underwater homeowners are still stuck in their homes as short sales and other foreclosure alternatives lose momentum, tilting the national home equity scales back slightly toward a higher share of negative equity," he added.
Markets with the highest percentage of seriously underwater properties in Q1 2015 were Lakeland, Florida, (28.7 percent), Las Vegas (28.4 percent), Cleveland (28.2 percent), Akron, Ohio (27.2 percent), Orlando (26.1 percent). Tampa, Chicago, Palm Bay and Jacksonville, Florida formed the next tier, all with 24 to 25 percent of their properties underwater.
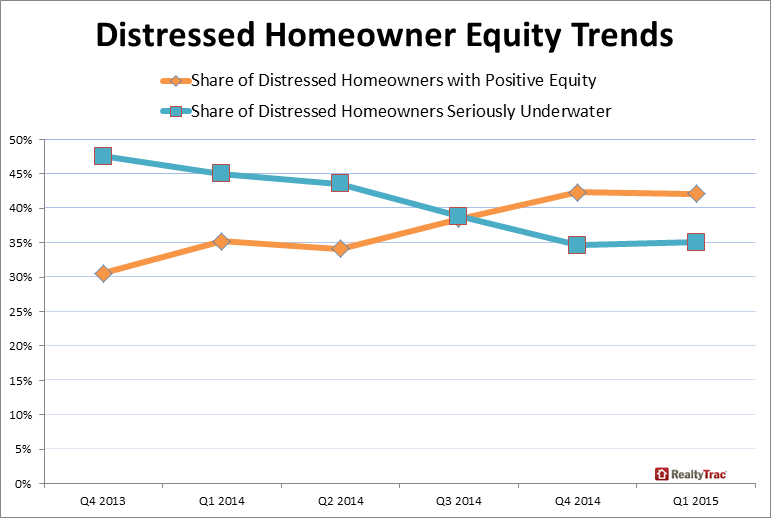
The proportion of homes in some stage of foreclosure that were seriously underwater rose during the quarter as well, to 35.1 percent. In the fourth quarter of 2014 34.6 percent of distressed properties lacked equity and in the first quarter of 2014 the number was 45.0 percent. However those distressed homes with positive equity, 42.1 percent, continued to surpass those that were seriously underwater.
The share of equity rich U.S. residential properties with at least 50 percent positive equity at the end of the first quarter was 19.8 percent. This is down slightly from Q4 2014 at 20.3 percent, but up 0.2 percentage points from the first quarter of 2014.
Major metro areas with the highest percentage of equity rich properties were San Jose (43.7 percent), San Francisco (38.6 percent), Honolulu (36.2 percent), Los Angeles (32.2 percent), and New York (31.0 percent).
When breaking out loans by property type, 11.9 percent of single family homes were seriously underwater while condos and multi-family homes came in at 16.6 percent and 21.8 percent respectively. For distressed properties 42.6 percent of condos were seriously underwater, followed by single family homes at 34.8 percent and multi-family homes at 30.4 percent. Among properties that were owner-occupied, 20.7 percent were seriously underwater but only 11.0 percent of non-owner occupied homes. The latter statistic probably reflects that investors bought many distressed properties for use as rentals at a discount, with all cash, or simply the fact that non-owner occupied loans have lower LTV requirements.
The percentage of loans seriously underwater were higher for loans originated during the housing bubble years of 2004 to 2008, with 38 percent of all loans originated in 2006 seriously underwater - the most of any loan vintage, followed by 2007 (33 percent), 2005 (30 percent), 2008 (23 percent), and 2004 (21 percent).


