
Recent postings on CoreLogic's Insights Blog have a couple of different views of some of the housing numbers generally taken at face value by those of us who follow them. Mortgage applications, cash sales, and home prices all got a second look and somewhat contrarian look.
In a posting titled Cash is all the Rage Thomas Vitlo says that while CoreLogic has consistently highlighted the cash share of home sales it hasn't focused on the share of cash sales in the condo/coop subgroup. What is striking about this data is the high numbers of condos being purchased for cash in select states. Slightly more than 80 percent of condo sales in Nevada and Florida, more than 75 percent in New York and Alabama and nearly 68 percent in Arizona have been all-cash and these five states account for over half of such condo sales in the country.
Looking at trends in the two highest cash-sale states Vitlo found there were three distinct time categories involved over the January 2000 to January 2013 period. During the pre-recession period - 2000 to 2007, credit was readily available to purchase condos and Nevada and Florida had an average condo cash share of 22.9 percent and 35.4 percent respectively. During the recession period, shares in the two states spiked and in the average post-recession shares have averaged close to their current level.
Vitlo concludes that during the recession, credit standards tightened and the market contracted, making it more difficult to finance a condo. Now post-recession, investors play an increasing role in condo sales and the market continues to shrink. "The effect of the recession has pushed condo cash shares much higher than pre-recession levels over the past five years and it doesn't look like that is changing in the short term."
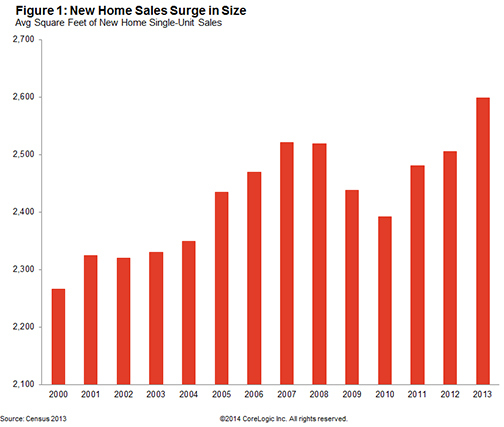
In a second entry, Sam Khater concludes New Home Prices are not Rising as Fast as You Think. While the numbers show that new home prices increased 18 percent between 2010 and 2013 there is more than ordinary appreciation involved. While the price increases reflect a very tight supply of new homes a second factor is the changing nature of the homes being built.
Since 2010 the size of a typical new home has increased by 9 percent to 2,598 square feet. In addition they now come with additional features such as more bedrooms, bathrooms, and fireplaces.
Khater says that when adjustments are made to account for bigger and better, one sees a quite different picture. The Census Bureau's constant-quality new home price index puts the 2010-2013 price appreciation at 9 percent, half of the raw number usually reported. These differences are even greater in what he calls "smaller geographies" and he cites the Midwest where there was a 19 percentage point difference between the 7 percent appreciation on the constant-quality index and the appreciation on the non-constant quality index.
Khater says that adjusting the price of new homes for quality reveals smaller increases but doesn't diminish the primary driver of appreciation, the lack of inventory, especially for new, affordable homes. "We may be building higher quality housing for tomorrow," he says, "but it could be at the expense of access to homeownership."
Finally, CoreLogic chief economist Mark Fleming took a closer look at the Mortgage Bankers Association's Weekly Mortgage Applications Survey and its continuing tale of falling application volume. During the week of which Fleming wrote total applications were down 56 percent on an annual basis. But most of that decline was due to a 70 percent drop in refinancing activity. At the same time he notes that the MBA's Purchase Index was also down 14 percent since the same period in 2013 equaling levels last seen in 2011.
But Fleming quotes Bill McBride at Calculated Risk who says the Purchase Index may be understating the amount of actual activity. McBride feels that small lenders are underrepresented in MBA's survey from which the indices are derived and "small lenders tend to focus on purchases."
In addition, Fleming says, CoreLogic data shows home sales increased by 8 percent year-over-year in February and by 5 and 7 percent in December and January respectively. So while the purchase application index has been indicating declining activity actual sales have been consistently growing on an annual basis. How, Fleming asks, can that be? "One possible explanation is that increasing cash sales could reconcile rising sales with declining purchase applications, but the cash sale share is declining (down to 38 percent in December 2013 from 44 percent a year earlier)."
Still Fleming says that "declining purchase applications don't necessarily mean there are fewer originations in the current market. In fact, our data shows more homes are being sold and proportionally more sales are being financed. Though the volume of purchase loans being originated is low by historic standards, the hopeful news is that the volume is, in fact, growing."


