
RealtyTrac reported today that an uptick in foreclosure starts last month drove an overall increase in the nation's foreclosure activity. There was a 7 percent jump in the filings of initial public notice - Notice of Default (NOD) or Lis Pendens (LIS), part of a total of 117,485 foreclosure related filings during the month. March filings, which also included Notice of Scheduled Auctions and Bank Repossessions (REO) were up 4 percent from February but were 23 percent lower than in March 2013. Scheduled Auctions were also up, rising 6 percent from the previous month.
There were 28,840 bank repossessions in March, down 5 percent from February and 34 percent from a year earlier. It was the lowest number of repossessions since July 2007, an 80 month low.
RealtyTrac said that March was the 42nd month in which foreclosure activity was lower than during the same period a year before and foreclosure activity in the first quarter was the lowest since the second quarter of 2007. In the first quarter there were 341,670 properties nationwide that received some type of foreclosure notice, down 3 percent from the fourth quarter of 2013 and 23 percent below one year earlier. Foreclosure notices were filed on one in every 385 U.S. housing units during the quarter.
Despite the continuous easing of the foreclosure crisis there were 29 states in which scheduled auctions were up on an annual basis. Utah posted a 226 percent increase; Oregon 177 percent, and Connecticut 131 percent. Several of the states with double-digit increases were those that have had perpetually elevated foreclosure activity such as New Jersey, New York, Nevada, and Florida.
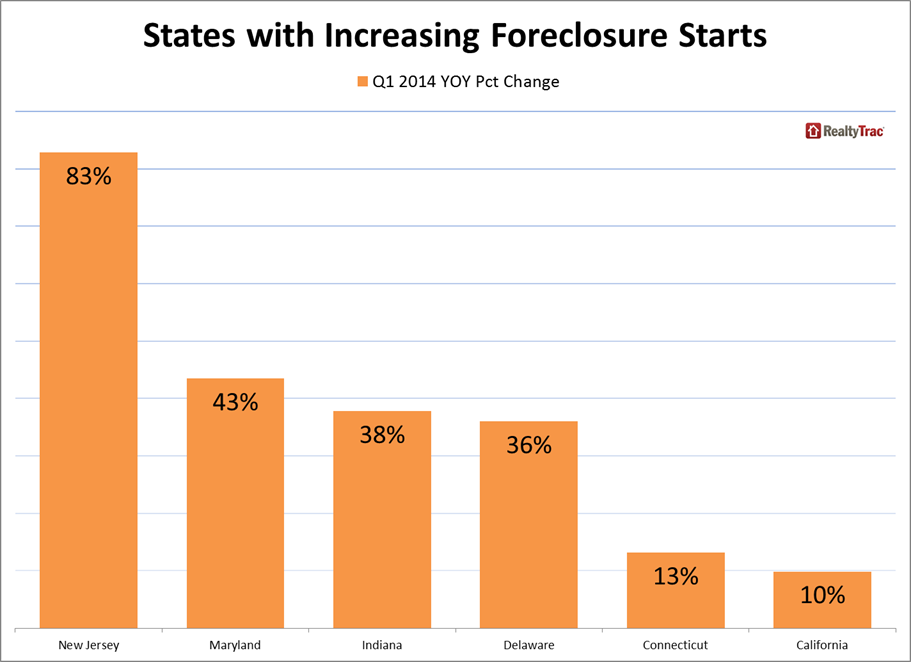
Along with the national increase foreclosure starts were up 19 states. New Jersey posted the largest change; starts there were up 83 percent, followed by Maryland, up 43 percent, Indiana, 38 percent, and Delaware 24 percent. A 10 percent increase in California was the first annual increase since the second quarter of 2012, and the first double-digit percentage increase since the fourth quarter of 2009.
"Now that the foreclosure deluge has dried up, banks are turning their attention back to properties that have been sitting in foreclosure limbo for some time," said Daren Blomquist, vice president at RealtyTrac. "This is most evident in judicial foreclosure states that were more likely to have impediments in the foreclosure process, but there are also signs of this catch-up trend happening in some non-judicial states like California, where an increasing number of judicial foreclosure filings boosted foreclosure starts in the first quarter.
"Banks will also now be able to devote more resources to dealing with the lingering inventory of nearly half a million already-foreclosed homes that still need to be sold," Blomquist continued. "Our estimates indicate only 10 percent of these bank-owned properties are listed for sale and more than half are still occupied by the former homeowner or tenant."
RealtyTrac's March and First Quarter U.S. Foreclosure Market Report featured other data highlights:
- There were 259,783 bank-owned properties with owner-occupancy data available in the first quarter - out of a total of 483,224 bank-owned homes nationwide. RealtyTrac said that 51 percent were still occupied by the former homeowner or a tenant.
Average days to foreclose
- U.S. properties foreclosed in the first quarter of 2014 were in the foreclosure process an average of 572 days, up 1 percent from 564 days in the previous quarter and up 20 percent from 477 days in first quarter of 2013. New Jersey overtook New York with the longest average time to foreclose in the first quarter, 1,103 days. That was followed by New York (986 days), Florida (935 days), Hawaii (840 days), and Illinois (830 days). In contrast it took 151 days to foreclose in Alaska, 169 in Texas, and 177 days in Delaware. New Hampshire and Alabama also took an average of slightly less than 200 days.
- U.S. bank-owned properties sold in the first quarter had been bank-owned for an average of 226 days when they sold, up 34 percent from the average of 168 days in the first quarter of 2013.
- Properties in the foreclosure process that sold during the first quarter took an average of 509 days to sell after starting the foreclosure process, up 33 percent from an average of 382 days in the first quarter of 2013.

Even though its rate was down 1 percent from the previous quarter, has decreased annually for three consecutive quarters and is down 19 percent from a year ago, Florida had the highest level of foreclosure activity in the first quarter. One in every 129 housing units in the state received a filing during the period.
Florida was followed by Maryland with one in every 189 housing units receiving a foreclosure filing, a one percent decrease from the fourth quarter but 35 percent above the level a year earlier. Nevada was third with its foreclosure rate, one in every 129 housing units. Nevada's filings decreased 8 percent in the first quarter and was down 48 percent from the first quarter of 2013. Illinois with one in 230 units involved had the fourth highest rate and New Jersey, one in 273, was fifth.


