
The conditional prepayment rate (CPR), the annualized percentage of total mortgage principal that borrowers prepay on a pool of loans in a given time period, dove steeply in the early part of this year. Black Knight Financial Services reports that there was a 40 percent decline in the rate over the active first lien mortgage universe. The company's current Mortgage Monitor, covering mortgage performance data through the end of February, looks at CPR, breaking its impact down by investor category, loan vintage, borrower credit score, and geography.
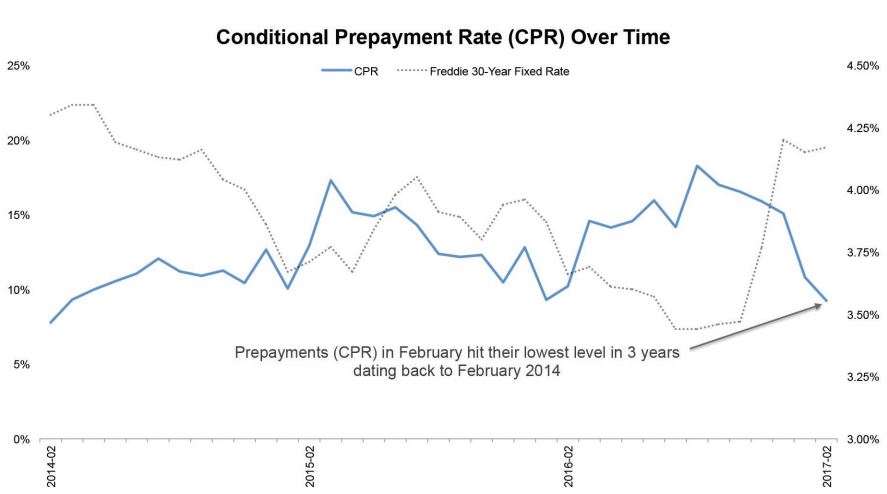
While CPR is typically driven by refinancing, a lot of the volume can be accounted for by housing turnover. Winter months are historically the low point for prepays, and this February's 9.2 percent rate was the lowest since February 2014 when interest rates were in the low to mid 4 percent range.
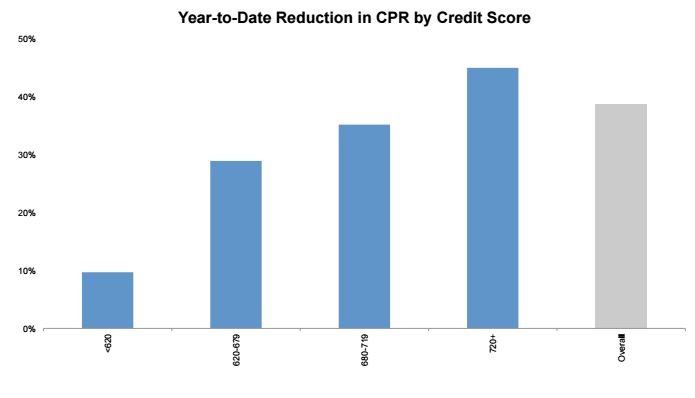
Rising interest rates have typically reduced refinancing activity and have a more pronounced impact on high credit score lending. The current situation fits that pattern. Black Knight says the CPR on loans with credit scores above 719 has dropped by 45 percent thus far in 2017 while prepays on loans with credit score below 620 are down only 10 percent.
Black Knight also finds that loans owned or guaranteed by Freddie Mac and Fannie Mae, (the GSEs), FHA, VA, and portfolio markets have all seen a drop in prepays of 41 to 43 percent so far this year while those held in private label securities have only dropped by 7 percent. Prepays on older vintage loans, those originated in 2008 and older, are only down by 11 percent, less than a quarter of the drop in post-crisis vintages. The newer vintages, loans originated in 2014 and 2015, had the largest decline in their CPRs, 50 and 52 percent respectively.
There is also a geographic component to the decline in prepayments, but that leads to another topic of this month's Mortgage Monitor, homeowner equity.
Black Knight says through the end of 2016 there were 56 straight months of year-over-year home price appreciation, 5.5 percent in 2016 alone. This has brought another million underwater homeowners back into positive equity ownership, reducing the underwater population by 33 percent, and leaving only 2.2 million homeowners owing more on their mortgages than their homes are worth, a 4.3 percent negative equity rate.
Rising prices have also increased the level of what the company calls "tappable" equity, that is equity above and beyond the 20 percent necessary for refinancing without private or FHA mortgage insurance. Tappable equity hit $4.7 trillion in 2016, the highest level since 2006. Just shy of 40 million homeowners now have combined loan-to-value (CLTV) ratios of less than 80 percent, 2.6 million more than a year earlier. Twenty-seven million of them have credit scores above 720 and they represent 78 percent of total tappable equity.
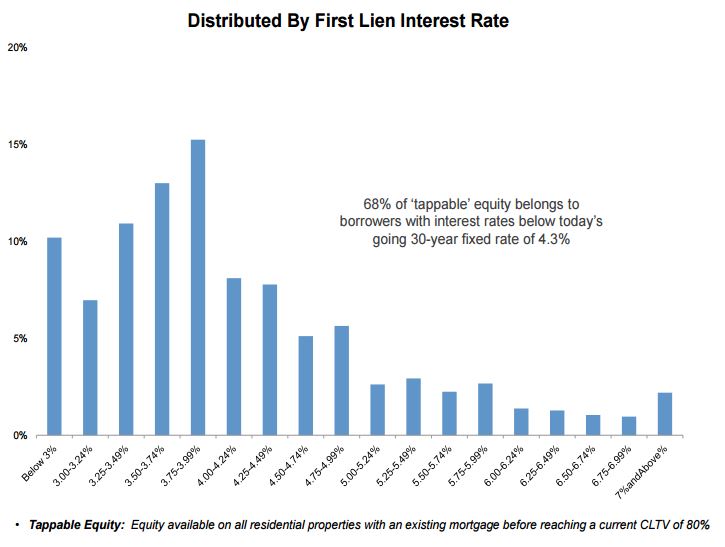
On the other hand, 68 percent of tappable equity belongs to borrowers with current mortgage rates that are lower than the prevailing 30-year rates today, up from 28 percent prior to the November rate increases. Rising rates have shifted the incentive away from tapping equity through a first lien refinance toward using home equity lines of credit (HELOC loans.) Simply put - there are only 2.8 million borrowers that are traditional refinance candidates, i.e. borrowers with 20 percent equity, 720 or higher credit scores, and a 75-basis point rate incentive.
The growth of equity, of course, tracks the course of price increases. So, while Seattle saw a 66 percent drop in negative equity in 2016, twice the national average, four of the largest 100 metropolitan areas, Oklahoma City, Austin, Baton Rouge, and St. Louis, saw negative equity increase. Austin still has among the lowest negative equity rates in the country (0.33 percent), while St. Louise has the highest of any major metro areas, 17.4 percent. Chicago has the largest volume of homes that are underwater, around 168,000, but the number did decline last year. Denver and Ft. Collins have the lowest rates, 0.3 and 0.2 percent respectively.
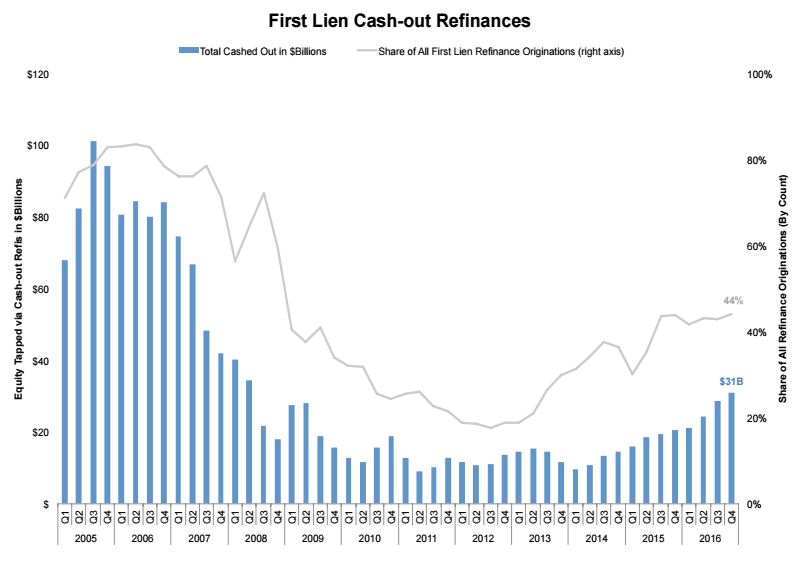
While rising rates may be eroding rate/term refinancing, the share of cash-out mortgages was increasing. At the end of 2016 homeowners extracted $31 billion in equity through 488,000 cash out loans. This was an 8.0 percent increase from the third quarter and up 50 percent year over year and the highest quarterly total since the second quarter of 2008. Despite the increase however, borrowers were tapping equity at less than a third of the rate they did in 2005 and doing so more prudently. The resulting loan-to-value ratio after refinancing in the fourth quarter averaged 65.6 percent, the lowest on record.
Cash-out refinancing accounted for 44 percent of total refinancing originations in the fourth quarter. While refinancing of all types is expected to decline as rates go up, Black Knight projects that the cash-out share will continue to rise and could account for 50 percent of refinances by year end.
The highest prepayment rates in the country so far this year are in the western states and in Florida and Black Knight suggests there is a strong correlation between those states and others with elevated prepayments rates and those states with the lowest weighted average CLTV ratios. The central and northern U.S. was impacted more by rising interest rates as lower home prices tend to result in lower rate volatility as well. The slightly higher prepayment rates there may also suggest a transition to more cash out refinancing.
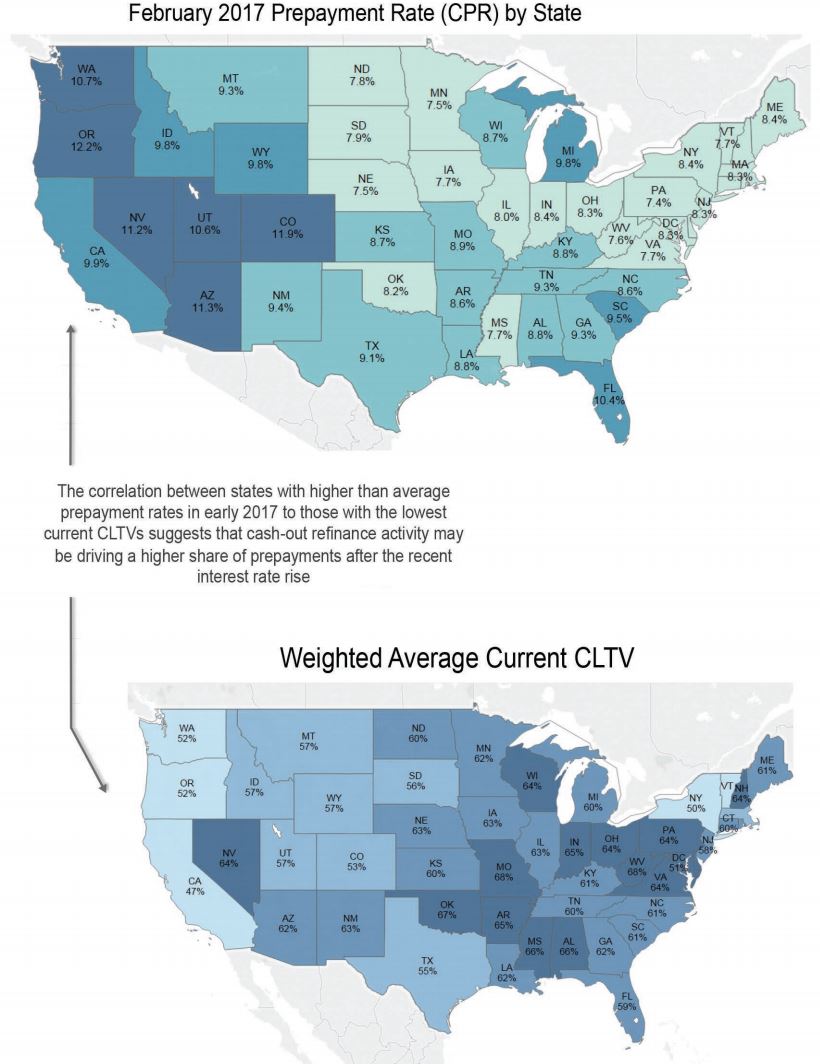
The relationship suggests that cash-out refinances may be driving a higher share of prepayment activity. These states also tend to have higher than average loan amounts as well.
The company says as interest rates rise, we many see the make-up of prepayments change, from rate/term refinances to more cash-outs and a higher share of prepays being accounted for by housing turnover.
The Monitor also noted that several Gulf Coast states have resisted the otherwise general decline in the nation's delinquency rates. While nationally delinquencies are down 60 percent from the January 2010 peak, the rates in Alabama, Louisiana, and Mississippi have come down only 33 to 43 percent. The national rate is now at 4.2 percent but those three states have rates 1.75 to 2.5 times higher. In Mississippi 10 percent of mortgaged homeowners are behind on their monthly payments. All three states have had rates higher than the national average for 15 years or more, but the disparity is now the largest since Hurricane Katrina in 2005.
Several factors may account for the elevated delinquencies; the states are among the poorest in the nation, with median incomes as much as 30 percent below the national average and poverty rates over 19 percent. FHA and VA loans make up 30 percent of active mortgages in the three states, 60 percent more than the national average, and these loans tend to have higher overall delinquency rates than loans requiring higher down payments. There is also a greater share in those states of low unpaid balance mortgages which tend to experience higher delinquencies that other loans.
The Mortgage Monitor also took an in-depth look at servicer retention. We will summarize those findings in a subsequent article


