There are two strong headlines in Black Knight's new Mortgage Monitor. One is that the pool of homeowners for whom a refinance makes sense increased by 50 percent in a single week due to the sudden drop in interest rates. Another is the second consecutive quarterly decline in tappable equity nationwide.
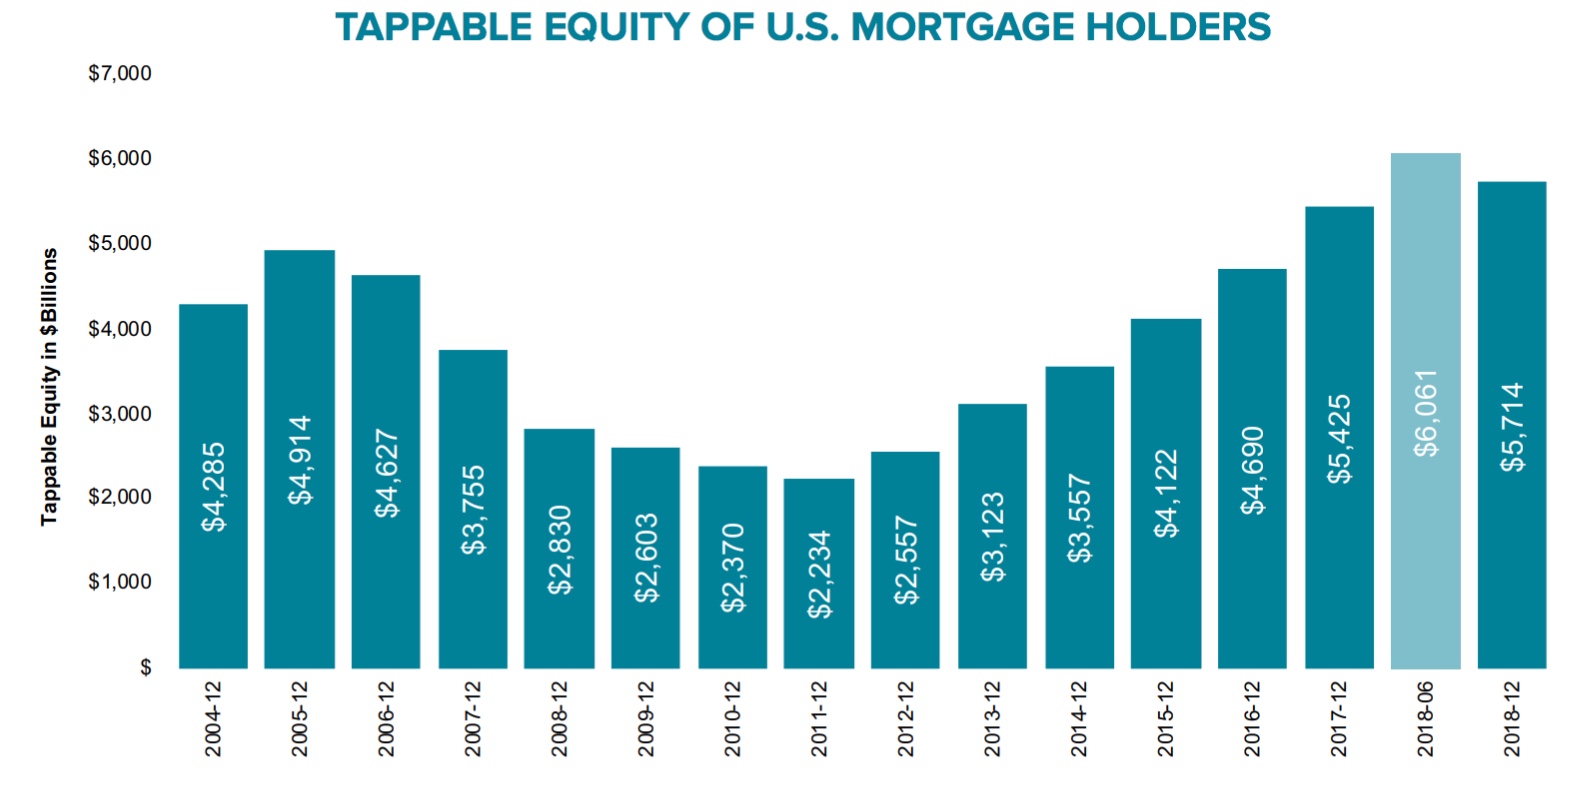
After rising more or less steadily for 14 quarters (starting in the third quarter of 2012), tappable equity retreated in both the third and fourth quarters of 2018. Tappable equity is the amount that a homeowner can withdraw through refinancing or a home equity loan (HELOC) without raising the loan-to-value ratio above 80 percent.
Nationwide, home equity reached a high of $6.06 trillion in the second quarter of last year. Since then it has fallen by $348 billion, with $229 billion of that drop coming in the 4th quarter alone. The drop was driven, in both quarters, by softening home prices.
Black Knight says the vast majority of the decline was among homeowners with 20 percent or more equity in their homes, so the impact has been in loss of borrowing power rather than placing any equity stress on the market. Still an estimated 63,000 homeowners fell back into negative equity over the two quarters.
Even with the loss, the steep increases in home prices during the first quarter of 2018 has left tappable equity at the end of 2018 higher than it was at the end of 2017. This is also true in 95 of the 100 largest markets, even factoring in cash-out refinances and HELOCS taken out during 2018. All told, tappable equity has fallen in two-thirds of states and large metros over the past six months
The largest decline on a percentage basis, 12 percent, was in Washington state where homeowners saw $33 billion in equity evaporate in the last six months of the year. The average home in the state depreciated by $13,000 over that period or 3.1 percent.
California had the largest dollar loss. Tappable equity there declined by more than $200 billion or 9 percent and accounted for more than 60 percent of the national downturn. Still the state continues to hold 37 percent of the national total, five times as much as second place Texas. The average home in California declined in value by $14,600 during the final two quarters of the year.

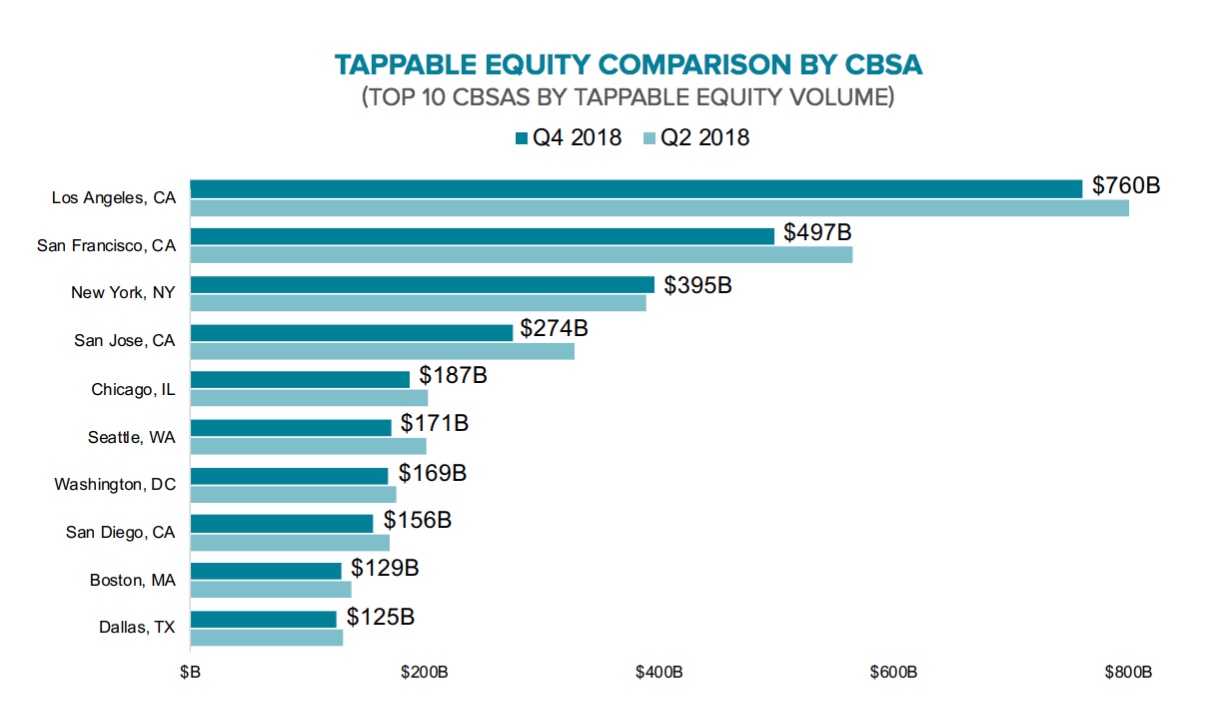
The pattern of loss held in nine of the ten local markets with the largest volumes of tappable equity and in all 15 of the largest California markets. The top ten markets shown in the chart below accounted for half of the nationwide total of tappable equity but 70 percent of the decline.
Equity withdrawals cannot be blamed for the equity losses. Black Knight says only $61 billion or 1 percent of equity was withdrawn in the 4th quarter, the lowest share since the recovery began in 2012. Withdrawals were down 8 percent compared to Q3 and 16 percent year-over-year. Withdrawals via equity lines or loans were down 10 percent both for the quarter and for the year, hitting the lowest level in four years. Cash out refis were down 21 percent on an annual basis but only 4 percent compared to the third quarter. Black Knight says this suggests consumers opted for cash-out refis despite rising interest rates.
Low mortgage rates tipped the balance of equity borrowing toward refinancing for the better part of the last three years. As rates neared 4.5 percent before peaking in the 4th quarter, there was a 50/50 split among refis and HELOCs. The last time rates were that high, 70 percent of borrowers opted for HELOCS. Those borrowing at all were a subset of homeowners - a larger share opted not to borrow at all.
Using 2017 as a benchmark, equity withdrawal that year was roughly equivalent to the post-recession average, Black Knight estimates that more than 600,000 homeowners may have foregone an equity withdrawal in 2018. That amounted to about 330,000 potential cash-outs and 300,000 HELOC candidates who forewent tapping equity as interest rates rose. With rates declining, we could see a sizeable rebound in homeowners tapping equity in upcoming months.
Refinancing overall was down in the fourth quarter; there were 483,000 originations, so even through equity borrowing was lower, 82 percent of all refinances extracted some equity, the largest share since the 2006 peak of 84 percent. Still, the volume of 1.7 million for the entire year was the lowest by count in 11 quarters. The average cash-out borrower withdrew $70,300
And speaking of rates, Black Knight points out that the 22-basis point drop in rates reported by Freddie Mac last week was the largest in a single month since 2008. This increased the pool of those who could likely both qualify for a refinance and reduce their rate by at least 0.75 percent by doing so. There are now more than 4.9 million homeowners in that pool, representing a doubling of the population in a single week. As of last Thursday, the 30-year rate was 4.06 percent, the lowest in more than a year and down nearly 0.9 percent from the most recent (November) high.
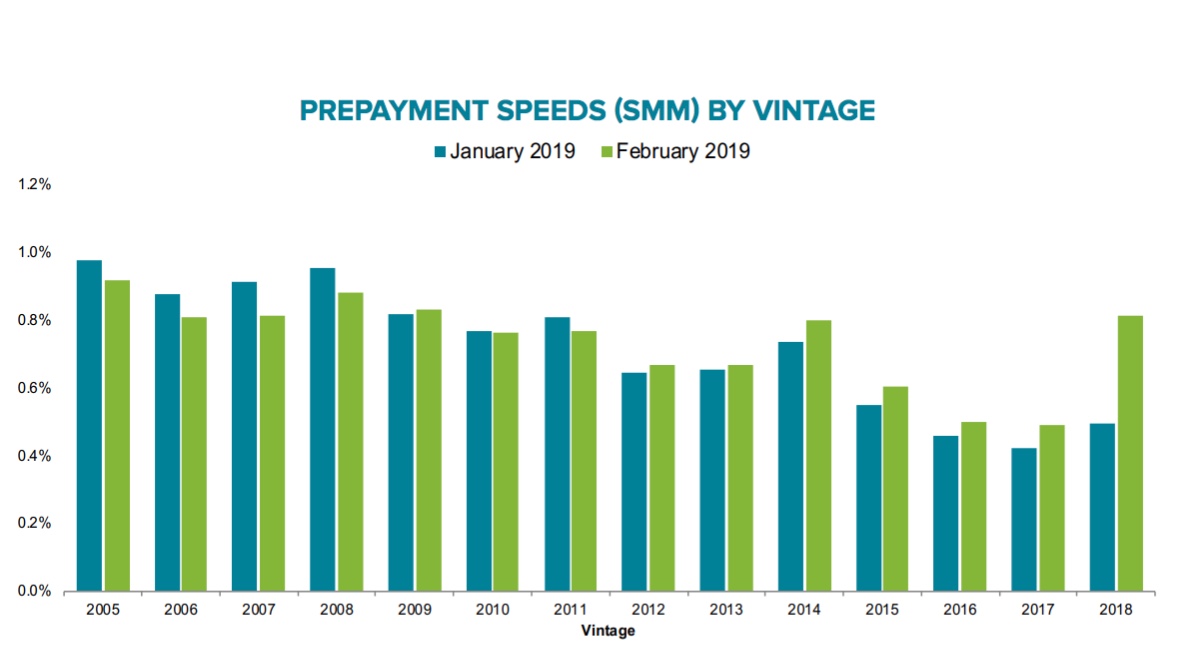
Black Knight's First Look report earlier this month touched on the February uptick in prepayment activity, but they look at it in more detail in the Mortgage Monitor. Despite the 11 percent increase, prepayments remain historically low.
The largest increase, 23 percent, was among portfolio loans. Their high average balances and high credit score make them more susceptible to prepay increases when mortgage rates drop. The second largest increase was a 15 percent gain in FHA/VA loan prepays, followed by Freddie Mac/Fannie Mae loans at 5 percent. Private label securities saw the only dip, 3 percent
Prepays among borrowers with credit scores above 720 were up 14 percent month-over-month. There was a small decline of the rate among loans held by borrowers with scores below 620.
The most recent loans, those originated last year, had the biggest increase of any vintage, up 60 percent in February. This suggests that recent borrowers are already beginning to take advantage of newly lower interest rates.