
Nationwide said on Tuesday that the overall housing market is healthier than at any time since 2001, the earliest point for which data is available and that data suggests there is little reason to fear a national housing downturn over the next year.
The insurance and financial services organization unveiled a new housing market indicator, the Leading Index of Health Housing Markets (LIHHM). The indicator's national score as well as regional readings and breakdowns will be released quarterly in Nationwide's Health of Housing Markets (HoHM) Report. (As an aside, we wonder if anyone at Nationwide ever pronounced that acronym aloud.)
Nationwide calls the LIHHM "a data-driven view of the near-term performance of housing markets based upon current health indicators for the national housing market and 373 metropolitan statistical areas (MSAs)." The company says the index focuses on the entire housing market rather than merely projecting house prices or home sales.
The indicator is calculated using local level data in four categories, employment, demographics, mortgage market, and house prices and has a range of 75 to 125 with 100 being a neutral value. Values are placed into performance rankings (+3, -1) to allow for better comparisons across MSAs; the raw values will be used only on the national level as it is not compared to other areas.
Fourth quarter 2014 data was used to determine the index level. In the latest period, household formations rose at a faster pace, but a continued tight mortgage-lending environment persists as an impediment to even stronger national housing activity.
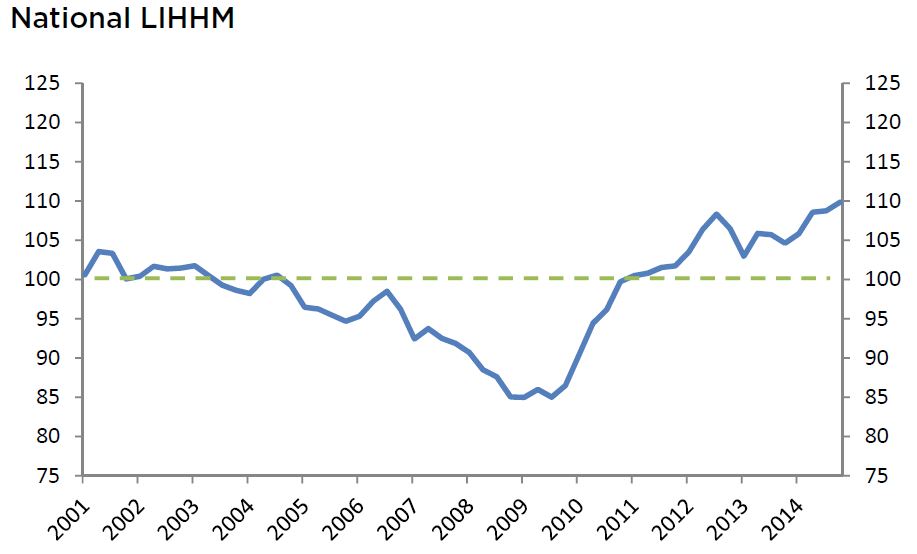
Specifically, the inaugural HoHM Report finds that the current leading indicator score is 109.8, a modest increase from the 108.7 score for the fourth quarter of 2014 and the highest level since 2001. An index value over 100 suggests the national housing market is healthy, with lower chances of a housing downturn over the next year as the index moves increasingly above the 100 breakeven value.
Nearly all of the MSA's are healthy with six scoring a +3 (very healthy) rating and 100 having a +2 rank. That means that few regional markets are vulnerable to housing downturns in the short term. The healthiest markets were found in Pittsburgh, Cleveland, and Philadelphia but all of the largest 40 MSAs were in positive territory and only six were neutral. The rankings were generally highest in the Midwest and Northeast, indicating that these are the regions that are least likely to have a near-term downturn.
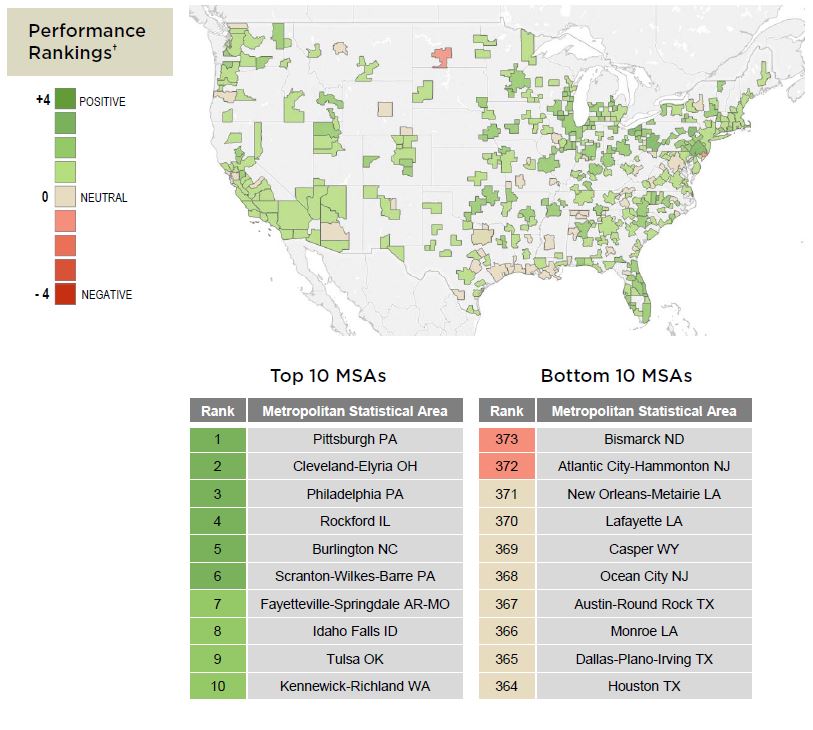
Of the bottom 10 (which include many of the high-flying energy areas such a New Orleans, Houston, and Dallas) only two, Bismarck and Atlantic City, were in negative territory which, the report says, suggests that even the bottom 10 isn't all that bad today.
About 25 percent of markets worsened over the past year while 29 percent improved. This, however was the smallest percentage with increasing values since 2009. Cities with the largest decreases were Bismarck, Bellingham, Washington; Roanoke, Bloomington, and Atlantic City. Regionally decreases were more prevalent in the South Atlantic and Gulf Coast areas.
The most improved City was Elmira, New York, followed by Ithaca, Erie, Decatur, Illinois; and Johnstown, Pennsylvania. Regionally there were pockets of increases centered in the Midwest and Northeast, the two regions as mentioned above that were strongest overall.
To validate the efficacy of its new indicator Nationwide showed how it would have performed prior to both the housing bust and its recovery. Even though housing prices did not peak until 2006, the LIHHM fell below 100 early in 2005 and by the fourth quarter of that year the vast majority of MSAs did so as well. This suggests that the national and almost all regional housing markets were not healthy and that a housing downturn was likely.
Following the housing bust and recession there was no rebound in home sales until the second half of 2011 and prices did not start to recover until 2012. However by the end of 2010 the LIHHM performance rankings turned positive or neutral in two-thirds of the regional markets and the national index crept above 100 by the start of 2011. This indicates a slightly better housing market and presages the current housing recovery.
"Unlike most other housing indices or surveys, the HoHM Report provides a look into the future instead of the rearview mirror," said David Berson, Nationwide's chief economist and senior vice president. "The quarterly report should serve as a resource to gauge how healthy housing markets are today but, perhaps more important, what to expect in the future and why."


