
Home prices flattened on a month-over-month basis in January even as annual prices continued to increase S&P Dow Jones Indices said today. The Case-Shiller indexes for national as well as selected metropolitan areas changed only minimally from December, partially attributable to usually cold and wet weather according to the S&P monthly report.
The U.S. National Home Price Index declined for the fifth consecutive month, slipping 0.1 percent from December. Both the 10-City and 20-City Composite indexes were virtually flat with only nine of the cities reporting positive changes. Charlotte, Miami, and San Diego had the greatest degree of appreciation, each were up 0.7 percent. They were tailed by Boston and Dallas with 0.4 percent gains. The largest loss was in San Francisco at -0.9 percent followed by 0.5 percent decreases in Washington, DC and Seattle.
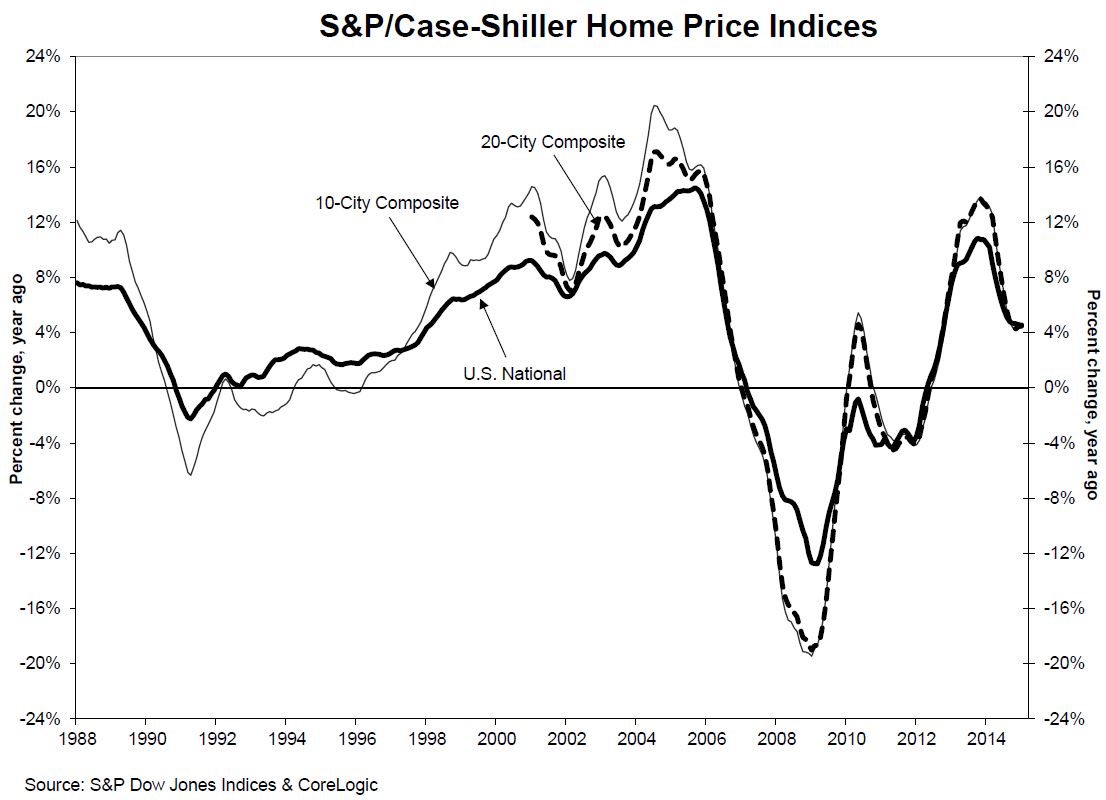
Both of the City Composites had larger year-over-year increases in January than in December. The 10-City Composite gained 4.4 percent year-over-year, up from 4.3 percent in December and the 20- City Composite increased 4.6 percent compared to 4.4 percent. The National Index rose 4.5 percent on an annual basis versus a 4.6 percent change the previous month.
Denver and Miami had the largest annual appreciation, increasing by 8.4 percent and 8.3 percent, respectively. Fourteen cities reported larger gains in January than in December. Chicago led with a reported increase of 2.5 percent, up 11 basis points from December. Six cities reported declines, with San Francisco again leading with a 12-month increase of 7.9 percent, a significant drop from Decembers reported 9.4 percent annual growth.
David M. Blitzer, Managing Director and Chairman of the Index Committee for S&P Dow Jones Indices said, "The combination of low interest rates and strong consumer confidence based on solid job growth, cheap oil and low inflation continue to support further increases in home prices. Regional patterns in recent months continue: strength in the west and southwest paced by Denver and Dallas with results ahead of the national index in the California cities, the Pacific Northwest and Las Vegas. The northeast and Midwest are mostly weaker than the national index.
"Despite price gains, the housing market faces some difficulties. Home prices are rising roughly twice as fast as wages, putting pressure on potential homebuyers and heightening the risk that any uptick in interest rates could be a major setback. Moreover, the new home sector is weak; residential construction is still below its pre-crisis peak. Any time before 2008 that housing starts were as low as the current rate of one million, the economy was in a recession."

By January prices in the two metropolitan composites had returned to their autumn 2004 levels. The indexes peaked in June/July 2006 and have now recovered to within 16-17 percent of those levels. The price trough was reached in March 2012 and since then the 10-City Composite has recovered by 28.2 percent and the 20-City by 29.0 percent.
The S&P/Case-Shiller Home Price Indices are constructed to accurately track the price path of typical single-family homes located in each of the selected metropolitan areas, combining matched price pairs for thousands of individual houses from the available universe of arms-length sales data. The National U.S. Home Price Index tracks the value of single-family housing within the U.S., combining indexes for the nine U.S. Census divisions. The indices have a base value of 100 in January 2000; thus, for example, a current index value of 150 translates to a 50 percent appreciation rate since January 2000 for a typical home located within the subject market. Detroit, with an index of 96.68, is the only metro area remaining below the base while Los Angeles has the highest index level among the 20 metropolitan areas at 226.36.


