
ATTOM Data Solutions, formerly known to us as RealtyTrac, has released an affordability report which shows that median home prices in the first quarter of 2018 failed to be affordable for average wage earners in 304 or 68 percent of the 446 counties the company analyzed for the report.
And a separate CoreLogic report tells us why.
The ATTOM report determined affordability by calculating the income needed to make monthly house payments; principal, interest property taxes, and insurance - on a median priced home. Their calculations presumed a 3 percent down payment, the minimum available from FHA and less than required by Fannie Mae and Freddie Mac, and a 28 percent maximum debt-to-income ratio on the "front end," that is required monthly payment on debt before adding the house payment factor.
Using the above parameters, the report says that nationwide it required 29.1 percent of an average wage earner's income to buy a median-priced home in the first quarter of 2018. This is slightly below the historic average of 29.6 percent of income. In other words, the nationwide median home price, $229,500, would require $57,009 in income. According to the Bureau of Labor Statistics, the average wage is $54,847, making a median-priced home unaffordable to an average wage earner.
Among the 304 counties considered unaffordable for average wage earners were Los Angles, Maricopa (Phoenix), San Diego, Orange (CA), and Miami Dade. The 142 counties still considered affordable were Cook (Chicago), Harris (Houston, Dallas, Wayne (Detroit), and Philadelphia.
Daren Blomquist, ATTOM Data Solutions senior vice president, said, "Coastal markets are the epicenter of the U.S. home affordability crisis, but affordability aftershocks are now being felt further inland as housing refugees migrate from the high-cost coastal markets to lower-priced markets in the middle of the country where good jobs are available," said Daren Blomquist, senior vice president with ATTOM Data Solutions. "That in turn is pushing home prices above historically normal affordability limits in those middle-America markets."

The ATTOM report contains an exhaustive list of U.S. counties and the various aspects and ramifications of their affordability or lack of it, but one bit of information stood out. Of the 10 most expensive counties (note, the criteria here was housing price, not affordability), eight experienced negative net migration. This means more residents moved out of the areas than moved in. These were the counties containing Brooklyn, San Jose, and Manhattan, as well as the California counties of Orange, San Mateo, Marin, Napa, and Santa Cruz.
If the situation is bad now, CoreLogic only sees it growing worse. Its Home Price Index Forecast suggests U.S. home prices will rise by about 5 percent this year. However, factoring in some interest rate forecasts leads to a conclusion that mortgage payments could increase nearly 16 percent. In other words, mortgage payments could rise at triple the rate of home prices.
CoreLogic utilizes what it calls a "typical mortgage payment" to assess affordability. It is calculated using Freddie Mac's average rate on a 30-year fixed-rate mortgage with a 20 percent down payment but does not include taxes or insurance. The company calls this a good proxy for affordability as it mimics the amount a borrower would have to qualify to obtain a mortgage to buy a median priced home.
Andrew LePage, writing in the CoreLogic Insights blog says a consensus of opinions from sources such as Fannie Mae, the Mortgage Bankers Association, and others is for an 82-basis point increase in mortgage rates between December 2017 and the end of this year. CoreLogic forecasts an increase in the median sale price of a home of 3.4 percent in real terms (5.1 percent nominal). Based on these predictions, the inflation-adjusted typical mortgage payment would move during the same period from $800 to $911. This would be a 13.9 percent year-over-year increase, 15.8 percent in nominal terms. With forecasts estimating that real disposable income will rise by about 4 percent this year, it is clear that homebuyers will have to devote a larger portion of their income to mortgage payments.
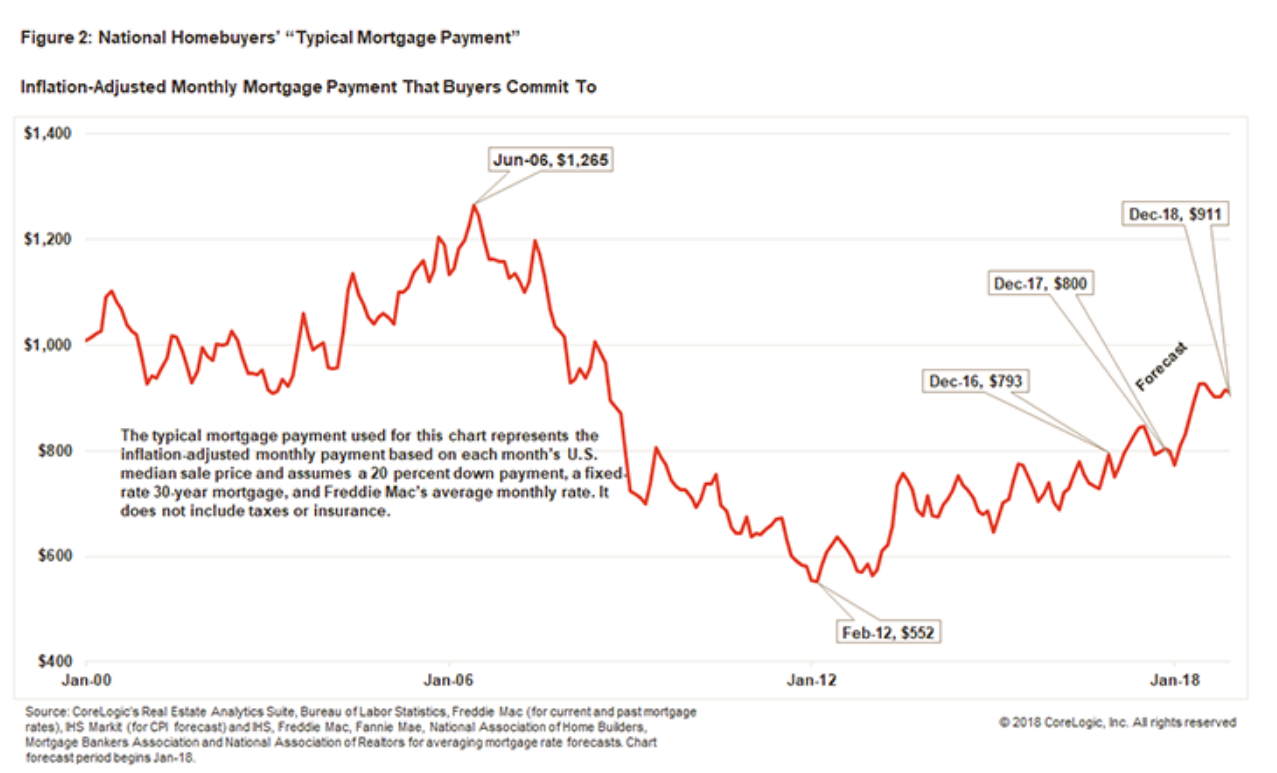
Figure two shows that, while the typical mortgage payment has trended higher in recent years, last December it was well below the all-time 2006 high of $1,265 even though there was not a lot of difference in home prices. Home prices in 2006 were a median of $246,576, or 199,900 in 2006 dollars. The median at the end of 2017 was about $35,000 less. Still there was a 36.8 percent difference in mortgage payments. because in 2006 the average mortgage rate was about 6.7 percent. In December 2017 it was under 4 percent.


