
The S&P CoreLogic Case-Shiller indices and the Federal Housing Finance Agency's (FHFA's) Housing Price Index paints two different pictures of the housing market in January. The former calls the appreciation in that month "the smallest in four years," while FHFA's index posted a January price surge.
Case-Shiller's U.S. National Home Price Index, covering all nine U.S. census divisions, reported a 4.3 percent annual gain in January on a non-seasonally adjusted (NSA) basis. In December the annual increase was 4.6 percent. On a seasonally adjusted (SA) basis prices grew 0.2 percent, but the NSA index lost 0.2 percent compared to December.
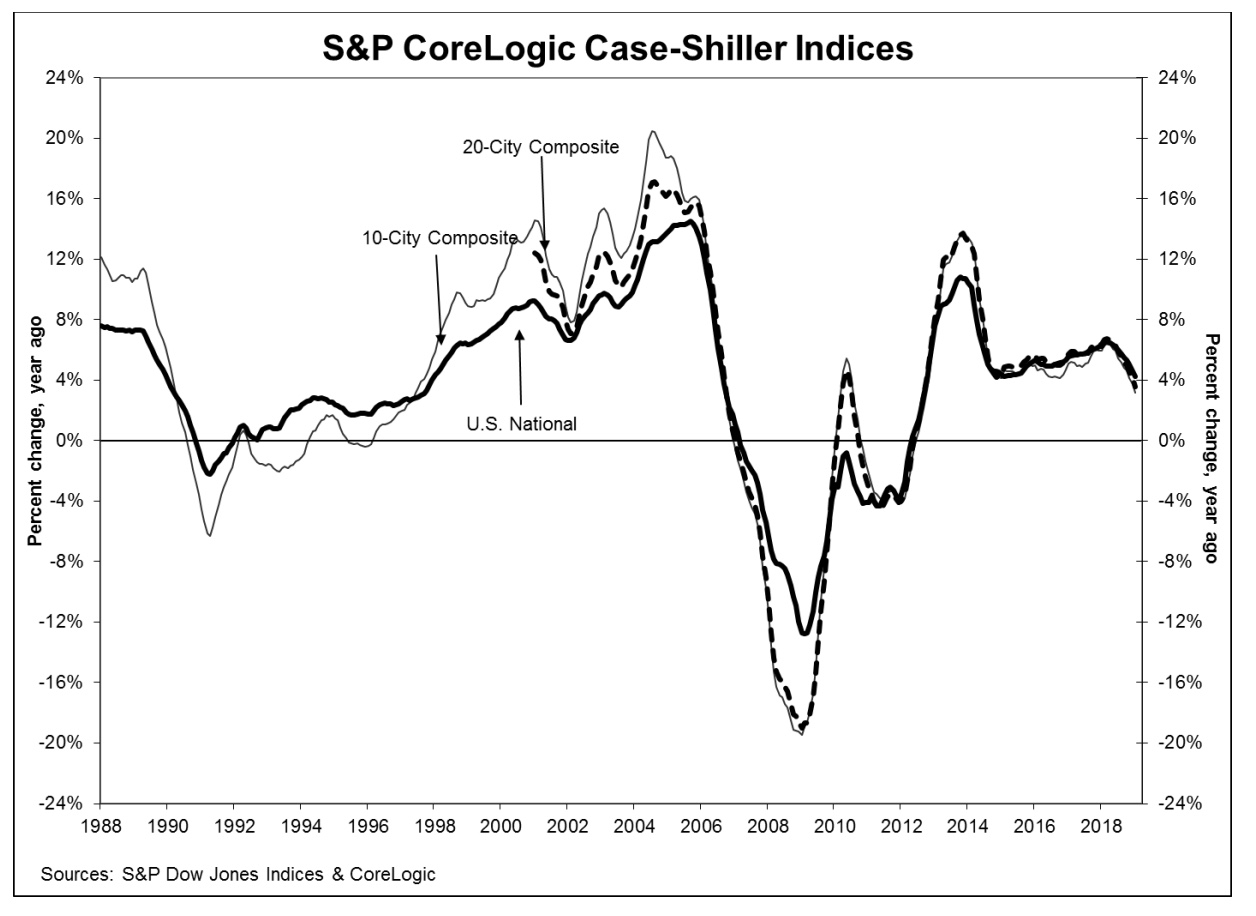
Case-Shiller's two composite indices show similar deceleration. The 10-City Composite's annual gain dropped from 3.7 percent in December to 3.2 percent while the 20-City increase went from 4.1 percent to 3.6 percent. On an NSA basis the 10-City index was down 0.3 percent and the 20-City fell 0.2 percent from the prior month. After adjustment the 10-City was unchanged, and the 20-City eked out an 0.1 percent gain. Five of 20 cities reported increases before seasonal adjustment, while 14 of 20 cities reported increases afterward.
Las Vegas and Phoenix continue to lead in home price increases among metro areas with 15.5 percent and 7.5 percent annual gains. Minneapolis moved into third place with 5.1 percent annual price growth.
Phoenix was the only one of the 20 cities to have a greater price increase in the year ending January 2019 versus the 12 months ending in December 2018.
"Home price gains continue to shrink," says David M. Blitzer, Managing Director and Chairman of the Index Committee at S&P Dow Jones Indices. "In the year to January, the S&P CoreLogic Case-Shiller National Index rose 4.3 percent, two percentage points slower than its pace in January 2018. The last time it advanced this slowly was April 2015. In 16 of the 20 cities tracked, price gains were smaller in January 2019 than in January 2018. Only Phoenix saw any appreciable acceleration. Some cities where prices surged in 2017-2018 now face much smaller increases: in Seattle, annual price gains dropped from 12.8 percent to 4.1 percent from January 2018 to January 2019. San Francisco saw annual price increases shrink from 10.2 percent to 1.8 percent over the same time period.
"Mortgage rates are as important as prices for many home buyers. Mortgage rates climbed from 3.95 percent in January 2018 to a peak of 4.95 percent in November 2018. Since then, rates have dropped to 4.28 percent as of mid-March. Sales of existing single-family homes slid gently downward from the 2017 fourth quarter until January of this year before jumping higher in February 2019. Home sales annual rate dropped from 5 million units in February 2018 to 4.36 million units in January 2019 before popping to 4.94 in February. It remains to be seen if recent low mortgage rates and smaller price gains can sustain improved home sales."
The National Index is now 10.9 percent above its July 2006 peak and the 20-City Composite is 2.9 percent higher. The 10-City has fallen back behind its previous peak and is 0.2 percent lower.
FHFA's report for January shows a strong increase in housing prices, an 0.6 percent increase for the month, doubling the December rate. On an annual basis the index is up 5.6 percent, a slight easing of the 5.7 percent rate in December.
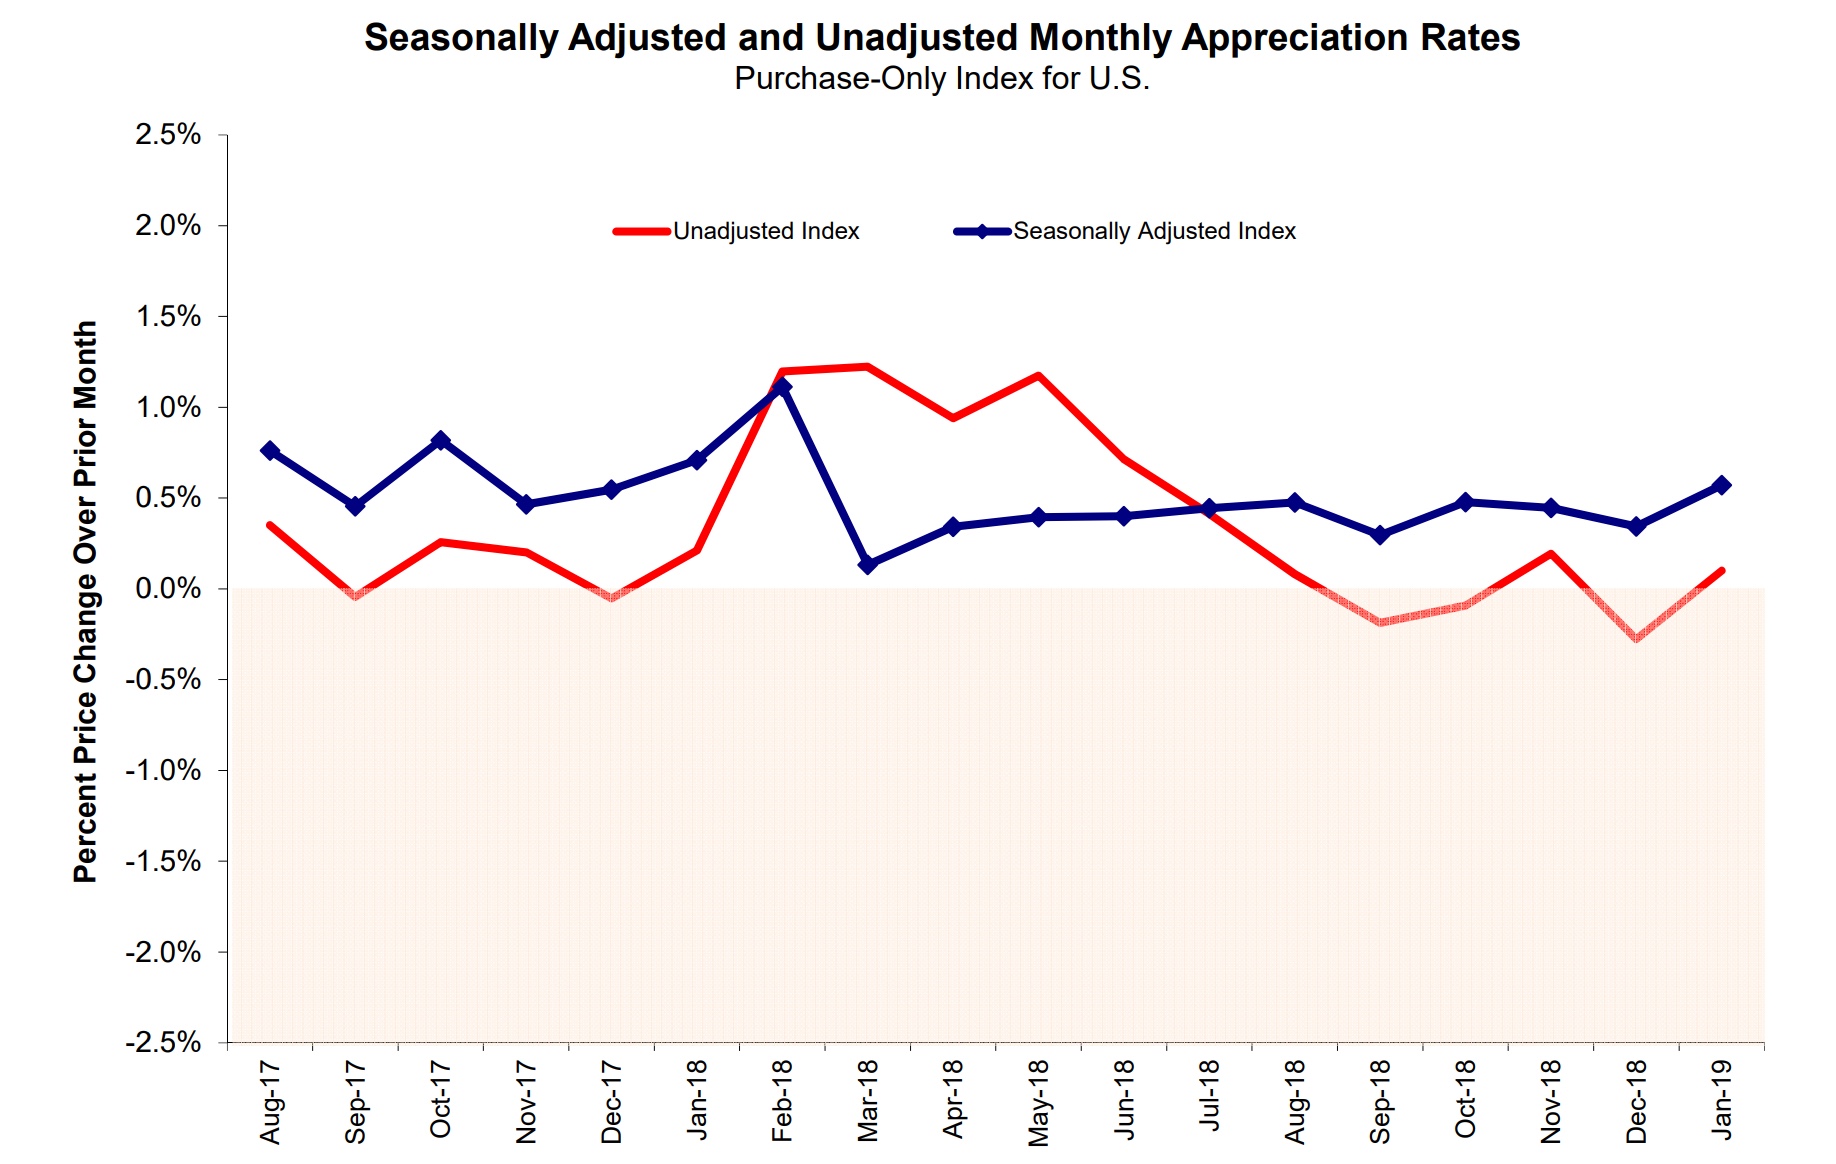
New England was the only one of the nine census divisions that did not post an increase for the month; its index fell -0.7 percent. The greatest increase was in the East North Central division, up 1.1 percent. The 12-month changes were all positive but were also all significantly lower than in January 2018. The current rates ranged from +4.3 percent in the Pacific division (down from 9.8 percent a year earlier) to +7.8 percent in the Mountain division compared to 10.3 percent.
FHFA's HPI tracks changes in home values for individual properties owned or guaranteed by Fannie Mae or Freddie Mac over the past 43 years using more than eight million repeat transactions. The Index was benchmarked at 100 in January 1991 and now stands at 272.0.
The S&P CoreLogic Case-Shiller Home Price Indices are constructed to accurately track the price path of typical single-family home pairs for thousands of individual houses from the available universe of arms-length sales data. The National U.S. Home Price Index tracks the value of single-family housing within the United States. The indices have a base value of 100 in January 2000; thus, for example, a current index value of 150 translates to a 50 percent appreciation rate since January 2000 for a typical home located within the subject market.
As of January 2019, the National Index was at 204.71, down from 205.35 in December. The 10- and 20-City Composites had readings of 225.93 and 212.41 respectively, compared to 226.61 and 212.96 the prior month. Los Angeles has the highest index at 280.87 and Detroit appears to have reclaimed the dubious honor of having the lowest from Cleveland at 123.26. We expect the Cleveland number is a misprint however, given the 19-point jump from December.
“Housing affordability has worsened over the past two years due to a combination of higher home values and rising interest rates. The second half of last year saw a slowdown in buyer activity. The resulting increase in inventory shifted the market in favor of potential buyers. While interest rates have come down since December 2018, many potential homebuyers continued their wait-and-see approach to avoid overpaying. As a result, the inventory level continued to rise in January, making any quick recovery in home price growth unlikely.”


