
It is conventional wisdom that homeownership is key to household wealth, and the National Association of Home Builders makes a convincing argument for that theory in its Eye on Housing blog. Jing Fu used data from the Federal Reserve's 2016 Survey of Consumer Finances (SCF) to show that, not only does equity in a home constitute the largest component of aggregate wealth nationwide, but it has a strong correlation with other sources of wealth on an individual basis.
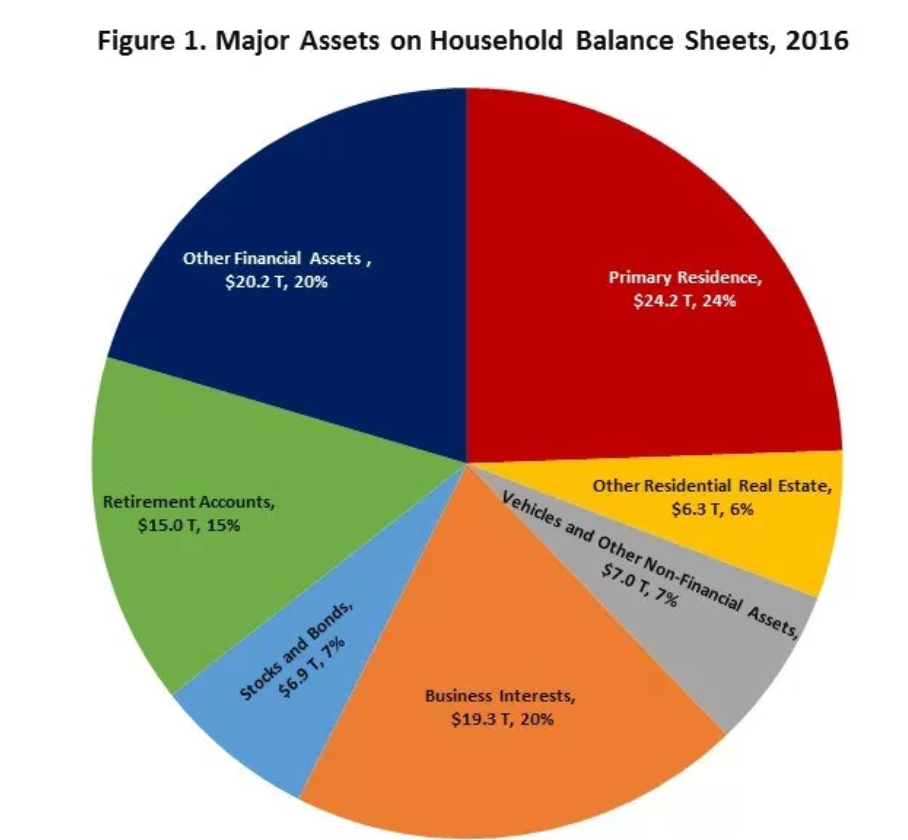
The $24.2 trillion aggregate worth of primary residences constitutes about a quarter of all wealth on the balance sheets of households, surpassing "other financial assets" which include loans to someone else, future proceeds, royalties, futures, non-public stock, deferred compensation, oil/gas/mineral investments, and cash, a category valued at $20.2 trillion, and $19.3 trillion in business interests. Each of those account for about 20 percent of all wealth. The next larges slice of the pie is $15 trillion held in retirement accounts.
As would be expected, overall household wealth grows with every step up in age groups. The $35.6 trillion in wealth held by households where the head is over age 65 is about 10 times that of the $3.7 trillion held by households headed by someone under 35.
As both the absolute dollar of homeowner wealth grows across age groups, it also becomes a less significant portion of the total. For example, for those under age 35, The $1.7 trillion in house wealth represents 46 percent of the total, with other financial assets far lower at $0.6 trillion. By ages 45 to 55 the primary residence number has grown to $5.4 trillion but is only 27 percent of the total. For those over the age of 65, the $7.4 trillion accounted for by the principal residence represents 21 percent of the household balance sheet.
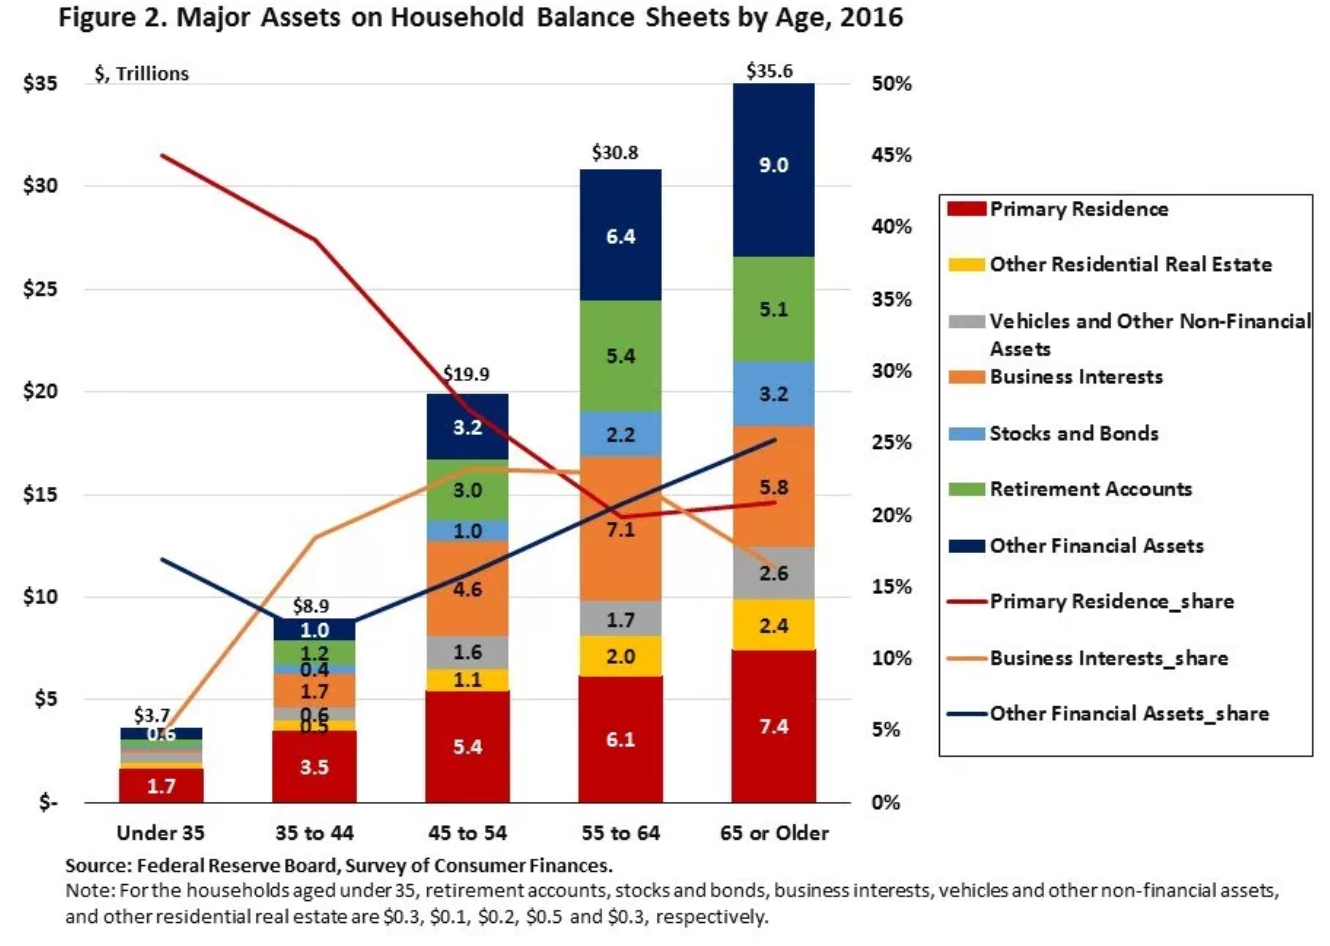
In Figure 2, the bars represent the distribution of major assets on household balance sheets by age categories in 2016 and the lines show the changes in the shares of the primary residence, business interests and other financial assets.
Fu says the aggregate value of the primary residence across age groups partly reflects higher homeownership rates, while the decline in the share of total assets represented by that value was offset by growth in the share of other asset categories in aggregate, most notably business interests, other financial assets, and retirement accounts.
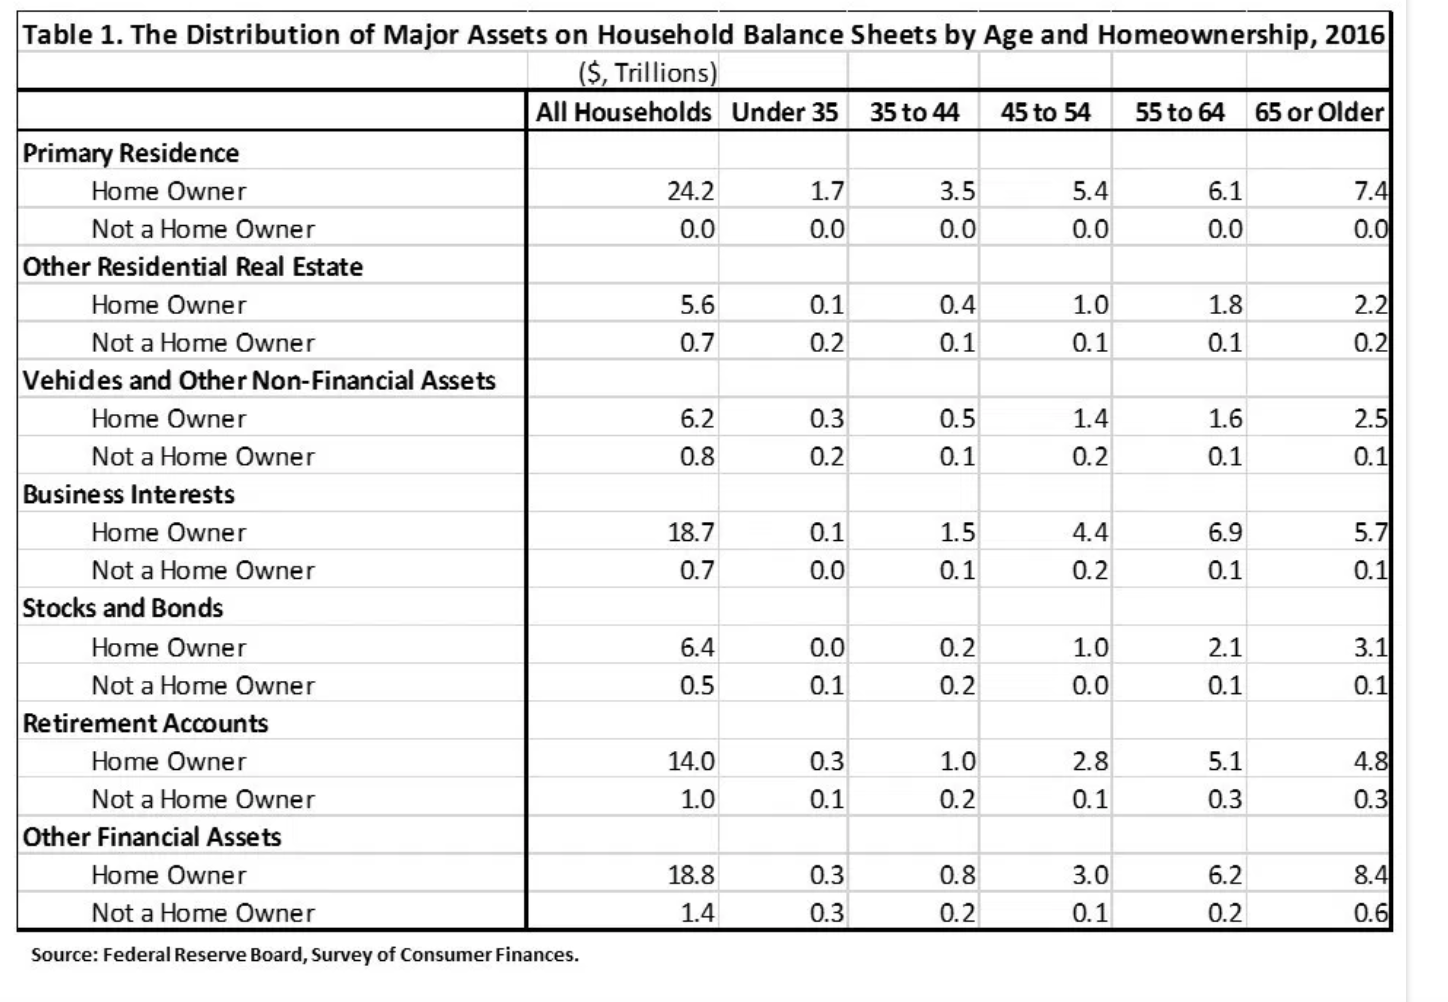
An analysis of the SCF suggests that the offsetting changes in the shares of these asset categories are not mutually exclusive. As shown in Table 1 below, the households who owned primary residences also owned the majority of the other assets in aggregate as well. The results shown in Table 1, combined with Figure 2 suggest that owner-occupied households expand into and build-up the value of other asset categories as well.
When looking at the median values of assets, the median value of homeownership rises from $160,000 for the youngest cohort to $200,000 and remains constant through the next three age groups, declining for those over 65. However, the value of homeowner equity rises consistently through all age groups as mortgage debt falls. While the median value of homeowners' primary residence remained constant between 35 and 64, the median value of homeowners' other financial assets and retirement accounts continued to rise over these categories. At the same time, the median value of business interests, other non-financial assets, and stocks and bonds among homeowners remained zero, indicating that fewer than half of homeowners own these assets at any age.
While a minority of homeowners own business interests, stocks and bonds, or other non-financial assets, the owners of these assets are likely to be homeowners. As a result, the median value of both non-financial and financial assets rose with age.
Among homeowners under the age of 45, home equity was the largest category of the household's net worth (the sum of medians does not equal the median of the total). However, for homeowners above the age of 45, non-primary residence equity eclipses home equity as the larger portion of net worth, reflecting the accumulation of other assets by homeowners in later life stages.
The 2016 Survey of Consumer Finances (SCF) was published by the Board of Governors of the Federal Reserve System. Compared to the quarterly Financial Accounts of the United States (previously known as the Flow of Funds Accounts), which provides aggregate information on household balance sheets. The SCF provides information about U.S. household balance sheets and is available every three years.


