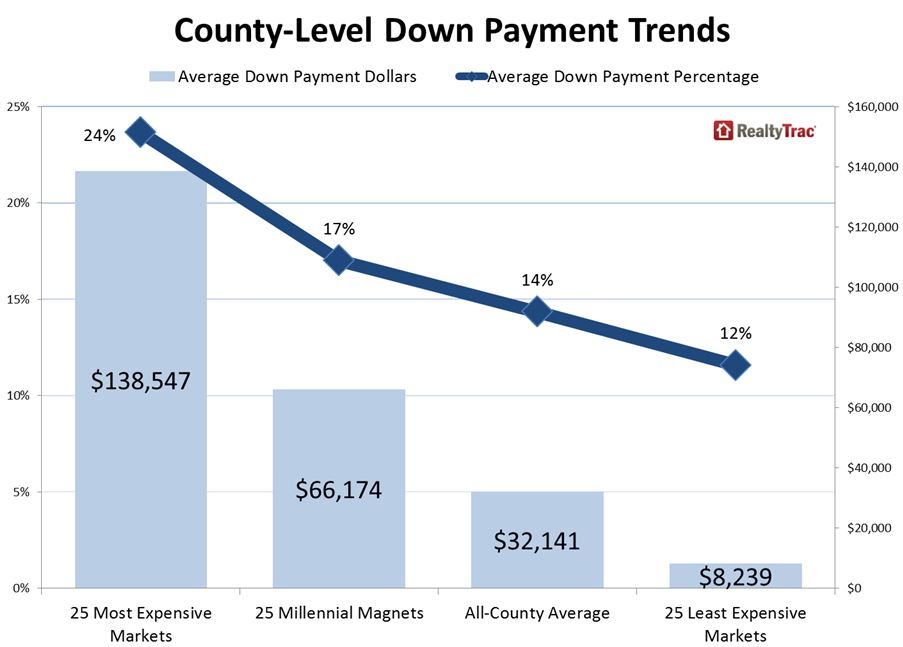
It seems counterintuitive, but RealtyTrac said today that persons purchasing homes in the highest priced communities in the US last year made significantly higher down payments on a percentage basis than did those purchasing in the least expensive communities - twice as large as a matter of fact. In the 25 least costly count-ies in the U.S. the average down payment on a single-family or condominium purchase was 24 percent in 2014 as opposed to 12 percent in the 25 least expensive counties. This number becomes even more surprising when those percentages are translated into dollars; an average of $138,547 versus $8,239.
The national average for down payments last year across the 386 counties in which RealtyTrac analyzed purchase loan and sales date was 14 percent or an average of $32,141. The study included data on 1.5 million home purchases.
Among the 25 costliest counties what were considered to be low down payment loans accounted for an average of only 7 percent of all home purchases while in the 25 least expensive counties 25 percent of homes were purchased using low down payments.
The highest average down payments in dollars were all found in New York and Northern California. In New York County where the median home price was $935,000 the average down payment was 37.18 percent or $347,614. San Francisco County had a higher median but lower down payment, an average of $305,467 or 30.01 percent. San Mateo County was third with an average of $254,779 down or 28.46 percent followed by Kings County in the New York metropolitan area at 28.20 percent and Marin County, also part of the San Francisco MSA at 27.81 percent.
At the other end of the scale were two counties in Michigan, Genesee which includes the city of Flint and Muskegon where down payments were 8.98 percent ($6,283) and 9.53 percent ($7,155) respectively. Clark County (Springfield) and Ashtabula Ohio were third and fourth with down payments around 9.50 percent and slightly above $7,100. Bibb County, home to Macon Georgia, with a median home price of $45,000 had an average down payment of $4,462 or 9.92 percent.
RealtyTrac also looked at the 25 counties which had seen the greatest increases in the number of millennials (persons generally born between the early 1980s and early 2000s) between 2007, the end of the Great Recession, and 2013. The average down payment in those counties was 17 percent or $66,174; three percentage points above the national average, but twice the average down payment in dollar terms.
5 Highest Average Down Payments among Millennial Magnet Markets
|
State |
County |
MSA |
Avg Down Payment Pct |
Avg Down Payment Dollars |
% Change Millennials 2007 to 2013 |
|
New York |
New York |
New York-Northern New Jersey-Long Island, NY-NJ-PA |
37.18% |
$347,614 |
42.79% |
|
California |
San Francisco |
San Francisco-Oakland-Fremont, CA |
30.01% |
$305,467 |
68.04% |
|
New Jersey |
Hudson |
New York-Northern New Jersey-Long Island, NY-NJ-PA |
21.83% |
$75,312 |
44.30% |
|
Massachusetts |
Suffolk |
Boston-Cambridge-Quincy, MA-NH |
21.42% |
$90,811 |
28.54% |
|
Virginia |
Arlington |
Washington-Arlington-Alexandria, DC-VA-MD-WV |
21.28% |
$114,688 |
82.24% |
5 Lowest Average Down Payments among Millennial Magnet Markets
|
State |
County |
MSA |
Avg Down Payment Pct |
Avg Down Payment Dollars |
% Change Millennials 2007 to 2013 |
|
North Carolina |
Cumberland |
Fayetteville, NC |
9.31% |
$8,287 |
20.77% |
|
Tennessee |
Montgomery |
Clarksville, TN-KY |
10.57% |
$14,144 |
46.34% |
|
Virginia |
PRINCE WILLIAM |
Washington-Arlington-Alexandria, DC-VA-MD-WV |
11.15% |
$32,891 |
22.23% |
|
Arkansas |
Pulaski |
Little Rock-North Little Rock-Conway, AR |
12.18% |
$15,472 |
20.57% |
|
Iowa |
Polk |
Des Moines-West Des Moines, IA |
12.46% |
$16,194 |
23.45% |
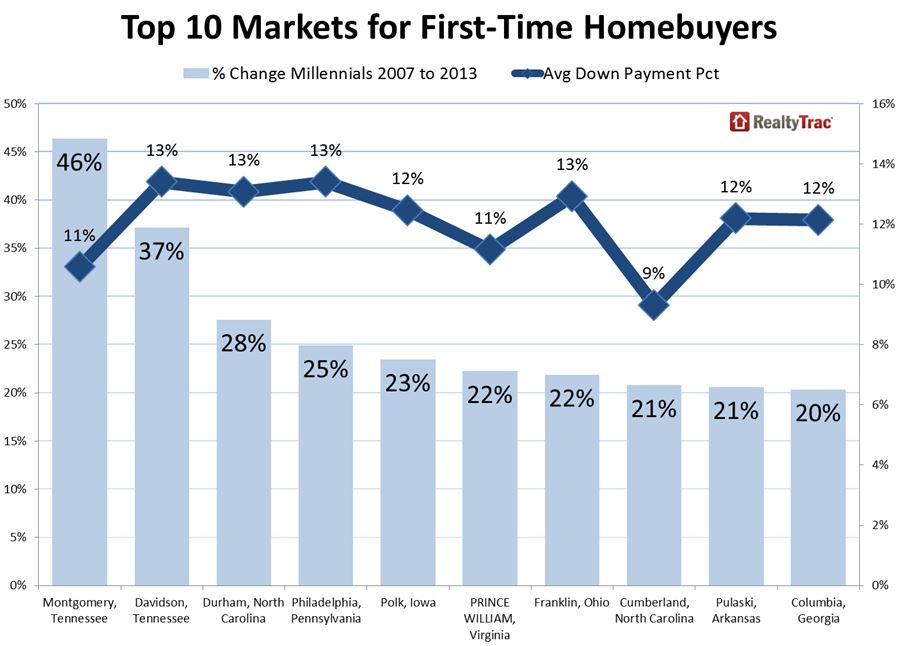
The company then identified the top 10 markets for first time homebuyers based on areas with an average down payment below the national average of 14 percent and an increase in the millennial population of 20 percent or more following the Great Recession.
|
State |
County |
MSA |
Avg Down Payment Pct |
Avg Down Payment Dollars |
% Change Millennials 2007 to 2013 |
|
Tennessee |
Montgomery |
Clarksville, TN-KY |
10.57% |
$14,144 |
46.34% |
|
Tennessee |
Davidson |
Nashville-Davidson--Murfreesboro--Franklin, TN |
13.40% |
$21,104 |
37.12% |
|
North Carolina |
Durham |
Durham, NC |
13.07% |
$20,326 |
27.58% |
|
Pennsylvania |
Philadelphia |
Philadelphia-Camden-Wilmington, PA-NJ-DE-MD |
13.40% |
$12,054 |
24.90% |
|
Iowa |
Polk |
Des Moines-West Des Moines, IA |
12.46% |
$16,194 |
23.45% |
|
Virginia |
PRINCE WILLIAM |
Washington-Arlington-Alexandria, DC-VA-MD-WV |
11.15% |
$32,891 |
22.23% |
|
Ohio |
Franklin |
Columbus, OH |
12.92% |
$16,536 |
21.86% |
|
North Carolina |
Cumberland |
Fayetteville, NC |
9.31% |
$8,287 |
20.77% |
|
Arkansas |
Pulaski |
Little Rock-North Little Rock-Conway, AR |
12.18% |
$15,472 |
20.57% |
|
Georgia |
Columbia |
Augusta-Richmond County, GA-SC |
12.14% |
$17,478 |
20.34% |
Daren Blomquist, vice president of RealtyTrac said, "This analysis shows that first time homebuyers have a better shot at buying a home in low-priced markets, not just because of the lower price point but because on average buyers are putting down just 12 percent in those markets compared to 24 percent in high-priced markets. Meanwhile, the markets where millennials are moving the most have above-average down payment percentages, which will make it tough for millennial renters to convert into first-time homebuyers in those markets.
"There are a few exceptions, however, where the combination of an influx of millennials and relatively low average down payment percentages indicate markets that will see a quicker return of the first-time homebuyer," he added. "Markets such as Nashville, Durham, Philadelphia, Des Moines, Little Rock and Columbus, Ohio."