
In an article that appeared recently in CoreLogic's blog, Popping the Housing Bubbly Theory, CoreLogic's Chief Economist Dr. Mark Fleming presents a different take on current home prices and whether recent gains are sustainable. Current thinking maintains that a housing bubble may already exist because home price appreciation has substantially outpaced the rate that rents have grown. Renting and owning are generally considered to be "economic substitutes," so Fleming says, "A significant difference in pricing should draw more demand to the less expensive option, therefore driving up pricing and removing the significant difference. This constant reversion to equilibrium between the two substitutes means any significant difference must be due to irrational exuberance on the part of the homeowner or renter."
But he argues for an alternative view. Because most homeowners use their income to pay their mortgage it follows that an established relationship exists between income and home prices. This relationship means that home price growth cannot be sustained at higher levels than income growth because housing would become unaffordable, demand would decline, bringing price growth back into alignment with income growth.
It is also important to note that the significant variation in income levels across markets directly influences housing differences. "A million-dollar home in San Francisco is very different from a million-dollar home in Columbus, Ohio," he points out.
Fleming says CoreLogic uses this fundamental relationship between house prices and income to forecast home prices. In each market there is a gap between the home price implied by the income level, i.e. the fundamental home price, and the actual or forecasted house price. This gap is measured as a percentage of the fundamental price. By constructing a composite measure of house prices relative to fundamental prices it is possible to construct a population-weighted average of the largest 50 market gaps over time. This allows us to see that house prices clearly got well ahead of what was fundamentally supported by income levels in the early 2000s and then there was a significant over correction. The figure below has been updated and provides a home price forecast through the end of 2015.
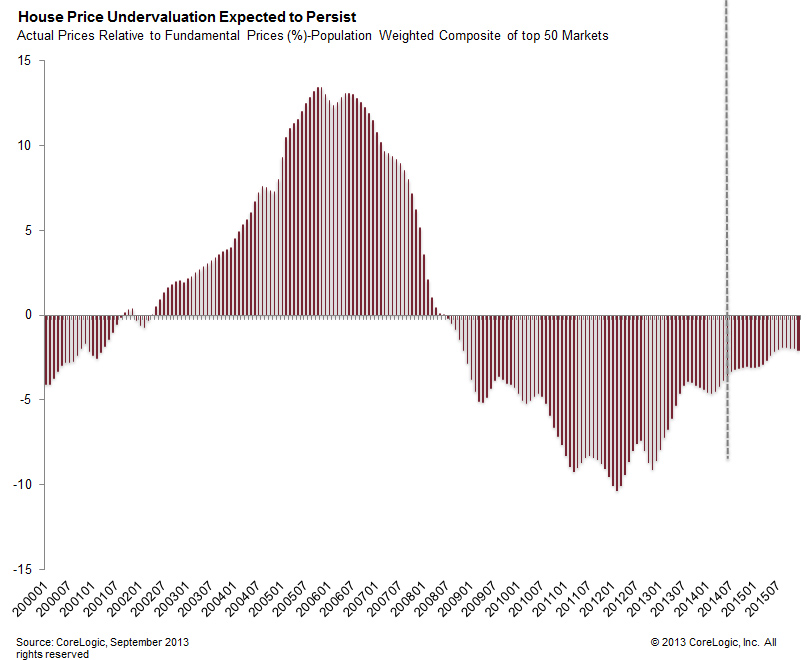
Fleming concludes that home prices, despite the double digit increases in the last two years, are actually undervalued relative to income and says that judging the bubbliness of prices cannot be done simply by comparing those prices to rents. "Doing so misses the point made earlier that much of the recent house price appreciation is a result of market correction for the significant undervaluation caused by the price declines in the late aughts. Instead, analyzing home price levels relative to fundamental prices leads us to conclude that there is no need to fear a bubble for at least a few years to come, if at all."
In a second blog piece titled Disproportionate Recovery in Housing's Freshman Year of Healing, Thomas Vitlo a Sr. Business Analyst in CoreLogic's Office of the Chief Economist looks at the distribution of new home sales in the market and geographically. New home sales in the current market, he says, are well below what we would expect in a more stable market, making up an 8.9 percent share of home sales in December compared to an average of 12.1 percent in 2000-2002. While new home sales are well below historic levels they have been increasing their share over the last year, but the growth is not evenly distributed.
Looking at the nation's census regions he finds that the southern states have some of the highest shares of new home sales while the northeastern state are not faring as well. Kentucky, Georgia, and Oklahoma have seen their new home share increase by 2.4, 2.0, and 1.6 percentage points respectively Connecticut fell 0.5 percentage points and New Jersey was down 0.5 points. Vitlo attributes this to the relatively inexpensive housing markets in the south while the three northern states have not had a significant new home rebound due to their being high cost housing areas.
But he offers another explanation for the discrepancy. Connecticut and New Jersey, as well as Massachusetts where the percentage of new home sales was unchanged, are judicial foreclosure states. This means they have longer foreclosure timelines which have prevented inventories of bank-owned real estate (REO) from clearing quickly. There are similar problems with distressed properties in the Midwest with the exception of the booming energy state of North Dakota.
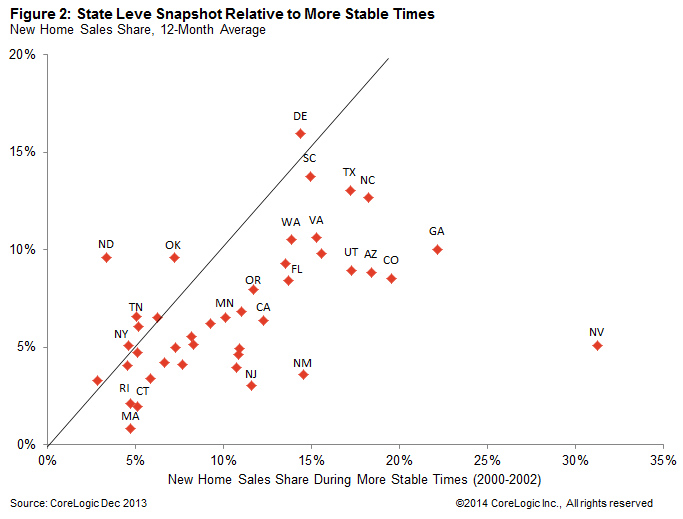
The second figure compares the monthly average new home sales share in 2013 compared to more stable times from 2000-2002. States that are above the line had higher new home sales shares in 2013 compared to 2000-2002 and can be deemed as improving. As an example, Nevada averaged a 31.2 percent new home sales share during the early 2000s, which was the highest share in the country, but in 2013 that share was only 5.1 percent, as limited supplies and distressed properties competed with the new home sales market.


