
Black Knight Financial Service's current Mortgage Monitor Report takes an in-depth look at home affordability and foreclosure metrics, both based on January 2015 data. The company says that foreclosure starts, both first time and repeat, reached 12 month highs during the month while home affordability, despite two years of price increases, remains better than before the housing bubble.
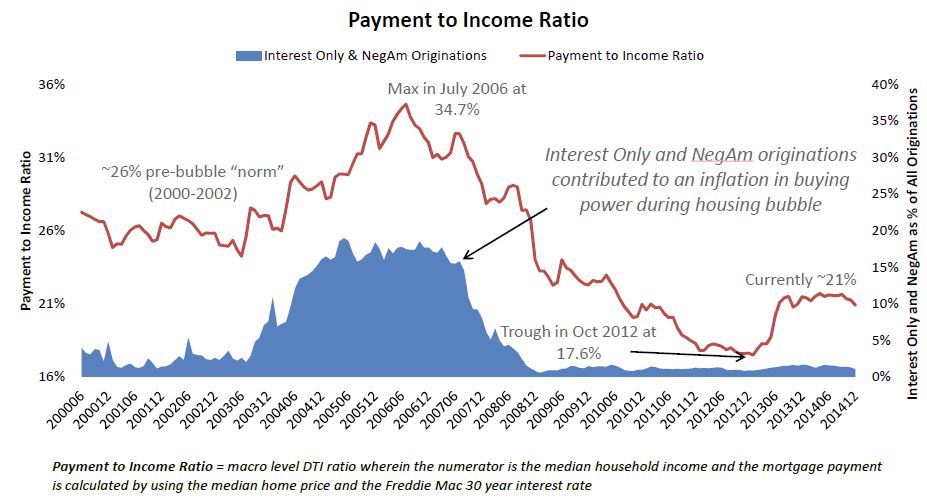
The Monitor reports that continued low interest rates have helped to offset price increases and that nationally the mortgage-to-income ratio stands at 21 percent. In the 2000-2002 period, before prices began to skyrocket, the average ratio was 26 percent. Still, the current ratio is up from October 2012 when it bottomed out at 17.6 percent. The ratio peaked in July 2006 at 34.7 percent.
The high mortgage-to-income ratio during the bubble years correlates, Black Knight points out, to a similar rise during that period with the use of interest only and negative amortization loans. The use/availability of those products were rare in the pre-bubble years and are virtually negligible today.
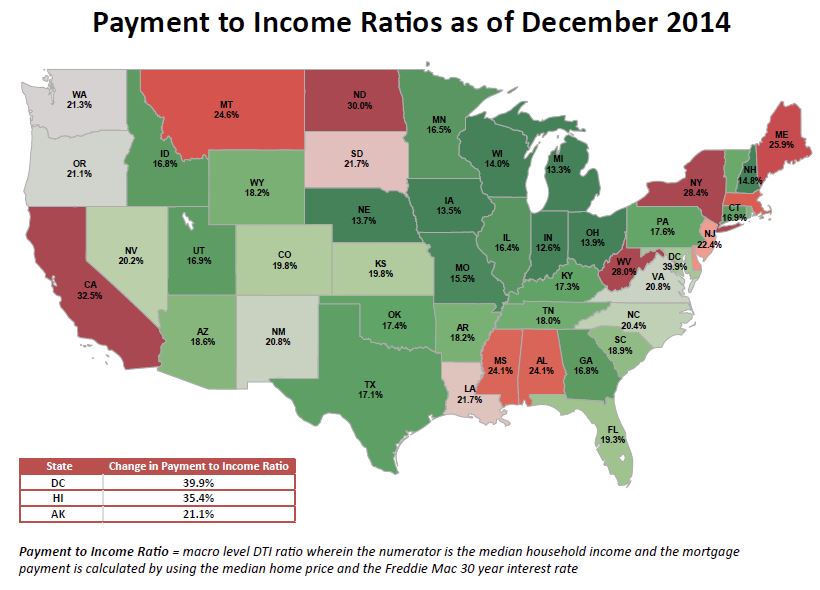
There are, of course, varying levels of affordability across the country. Washington, DC; Hawaii and California are the least affordable locations while Indiana, Michigan, and Iowa have the most homes that are affordable to households earning a median monthly income.
In Washington the current payment-to-income ratio is 40 percent, nearly twice the national average but well below the 62 percent the District reached at the peak. In Hawaii the ratio is just over 35 percent and it is 32.5 percent in California. In contrast the ratios in Indiana, Michigan and Iowa are 12.6, 13.3, and 13.5 respectively.
In Washington, DC; Hawaii, and Alaska (currently at 21.1 percent) the ratios are already higher than in the pre-bubble years and California is nearing that point. The recovery has been far less in Illinois and Mississippi where ratios are more than 10 percent below those 2000-2002 averages.
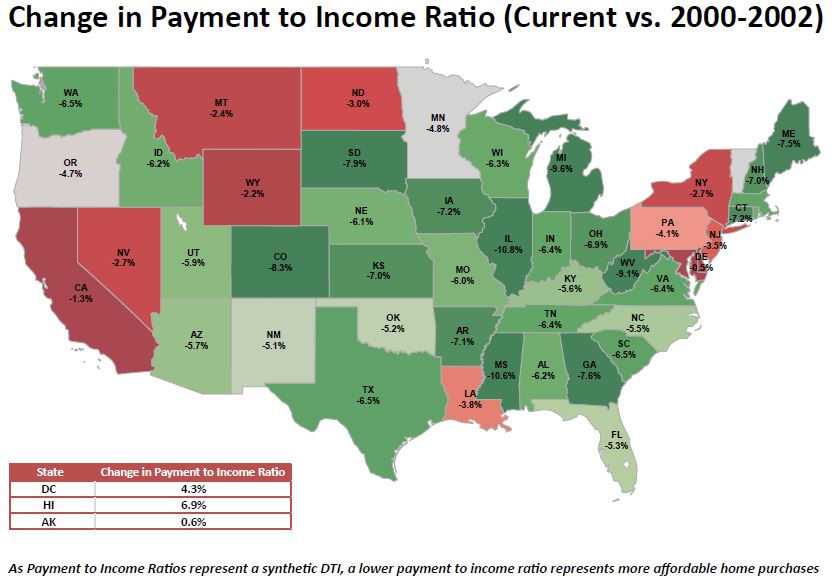
Black Knight said that a one percent increase in interest rates would push California and an additional seven states (Maryland, Delaware, New York, Montana, North Dakota, and Wyoming) above pre-bubble levels. At the national level, home prices could rise another 25 percent, or interest rates could jump almost two percent, before the affordability ratio would reach pre-bubble levels.
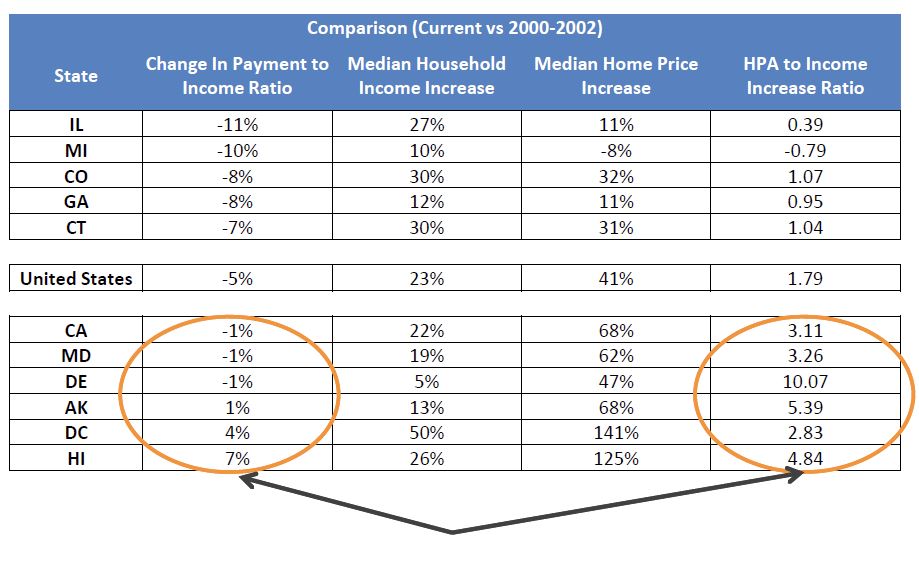
Interest rates aside, however, Black Knight points out that affordability ratios are more favorable in those states where income has kept pace with home price increases. For example, in Illinois the payment to income level is 11 percent below 2000-2002 levels. There median household income has increased by 27 percent since that period while home prices are up 11 percent. On the other hand, income in Washington, DC has risen 50 percent while home prices are up 141 percent and the 26 percent increase in median income in Hawaii does not offset the 125 percent increase in home prices.
In its closer examination of January foreclosure data Black Knight said there was clear separation in the levels of increase by first time and repeat foreclosure starts in reaching their 12-month highs. There was also a continuation of the differences seen across multiple foreclosure indicators between judicial and non-judicial states.
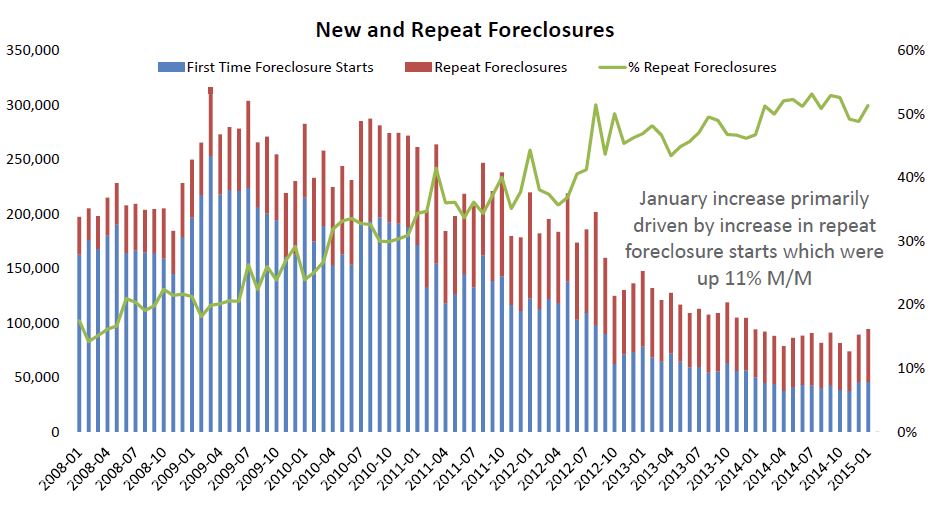
Trey Barnes, Black Knight's senior vice president of Loan Data Products said, "Repeat foreclosure starts made up 51 percent of all foreclosure starts and increased 11 percent from December. In contrast, first-time foreclosure starts were up just a fraction of a percent from the month prior. Similarly, Black Knight found that January foreclosure starts jumped about 10 percent from December in judicial states as compared to just a 1.7 percent increase in non-judicial states. Judicial states are also seeing higher levels of both new problem loans and serious delinquencies (loans 90 or more days delinquent, but not yet in foreclosure) than non-judicial states, although volumes are down overall in both categories."
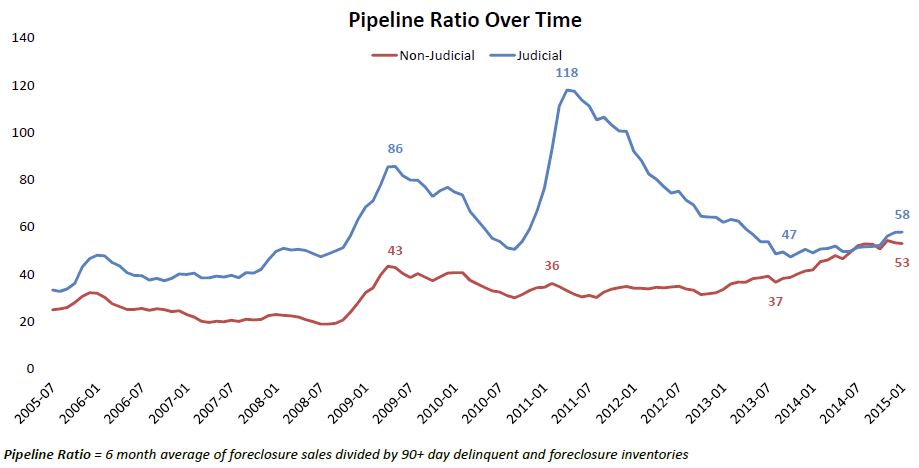
Foreclosure sales or completed foreclosures however have been dropping more rapidly than the inventory of seriously delinquent loans in both judicial and non-judicial jurisdictions leading to increases in foreclosure pipeline ratios. These ratios, representing the backlog in months of foreclosure and 90-day delinquency inventory based on foreclosure sales rates, have been increasing across the board. Barnes said the pipeline now stands at 58 months in judicial states, up from 47 months in 2013 but "a far cry from its high of 118 months a couple of years before that." The non-judicial pipeline has risen to 53 months, close to an all-time high, in recent months. "Throughout the housing crisis," he said, "non-judicial pipeline ratios were significantly lower than those in judicial states."
Black Knight said that January data also showed the impact of anti-dual-tracking legislation which prohibits the simultaneous pursuit of loan modifications and foreclosures. After this legislation went into effect the average months of delinquency for first-time foreclosure starts shot up from 6.5 months to 14.6 months and last year there were virtually no starts on loans less than 120 days delinquent.
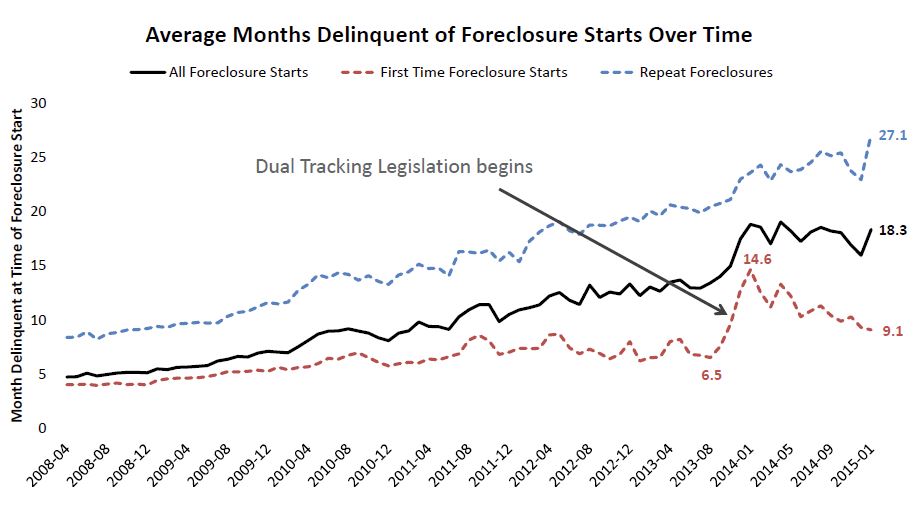
The company noted that, as servicers have adapted to the new requirements, the effect on foreclosure start timelines has become less pronounced. As of January 2015, first-time foreclosure starts were occurring at an average of 9.1 months delinquent.


