
CoreLogic has been watching for signs of overvalued markets for some time. The company and its lead analysts Frank Nothaft, Molly Boesel, and Sam Khater have produced a special report "Evaluating the Housing Market Since the Great Recession," which plots the path that led to what can fairly be called a mixed recovery.
Starting in December 2007 the country trod a path that, over the next two years, ultimately led to 8.7 million jobs lost, an unemployment rate that peaked at 10 percent, and over $16 trillion in lost household worth. The situation began to turn around in 2010 and over the next seven years the economy grew by 19 percent, added jobs for 88 consecutive months, and saw unemployment drop to 4 percent by the end of 2017.
As the economy recovered, so did the housing market. Home prices, which fell by 33 percent from their 2006 peak before hitting bottom in 2011, have returned to and in many locations surpassed prior peak levels, growing 51 percent from the bottom. The average house price is now 1 percent higher than it was at the peak in 2006, and the average annual equity gain was $14,888 in the third quarter of 2017.
However, the recovery has been anything but even. Boesel says, "With the availability of affordable housing on the decline, an out-of-balance housing supply and demand ecosystem, and geographic shifts in the labor market, home price trends across the country tell a colorful tale of state-to-state economic health."
Among the states that were hardest hit by the home price downturn were six located in the Western region - with peak to trough losses of 32 to 60 percent. These are among those that have experienced the greatest price growth in the recovery. Nothaft says, "Greater demand and lower supply - as well as booming job markets - have given some of the hardest-hit housing markets a boost in home prices. Yet, many are still not back to pre-crash levels. "
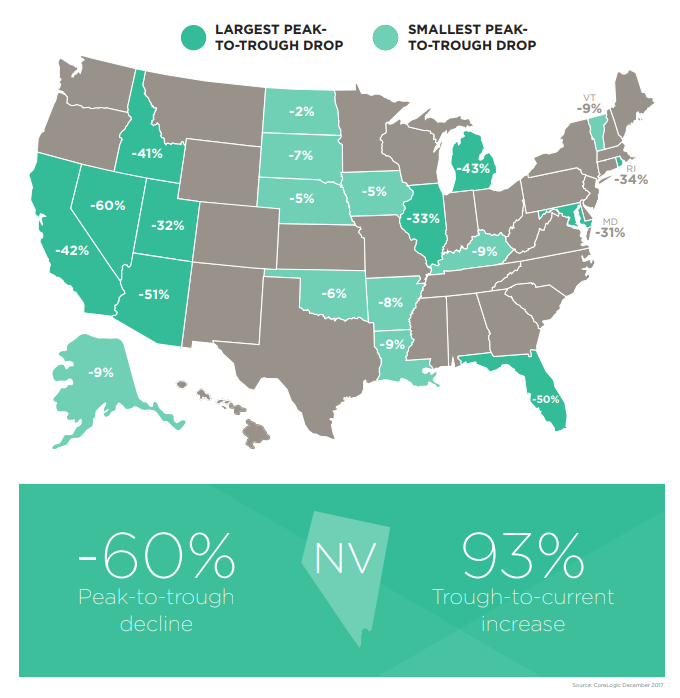
In many of the hardest hit states - which also include Illinois and Florida - housing prices have failed to reach pre-recession levels, and today nearly 2.5 million residential properties with a mortgage are still underwater.
In Nevada, where prices declined 60 percent, the greatest loss in the nation, prices have risen 93 percent from the trough, but remain 23 percent below the pre-recession peak. Nine percent of mortgaged properties are still in negative equity, second only to Louisiana where home prices only fell 9 percent during the crash.
Arizona and Florida, both saw home prices drop by about 50 percent and are still down by 16 percent from their respective peaks. California, on the other hand, experienced a 42 percent decline but has since recovered and seen home prices rise 2 percent above the pre-crash level.
Some states that only experienced shallow losses, North Dakota, Nebraska and Iowa for example had peak-to-trough losses of 2 percent, 5 percent and 5 percent, have more than regained that ground. North Dakota, the beneficiary of an energy boom, is up 48 percent from its prior peak, while Nebraska and Iowa are 27 percent and 15 percent higher respectively than before the crash. However, the pace of price increases in those states is below the national average. The equity gain nationally from the third quarter of 2016 to the same period in 2017 was $14,888; North Dakota homeowners have gained an average of $8,344, Nebraska $8,054, and Iowa $7,720.
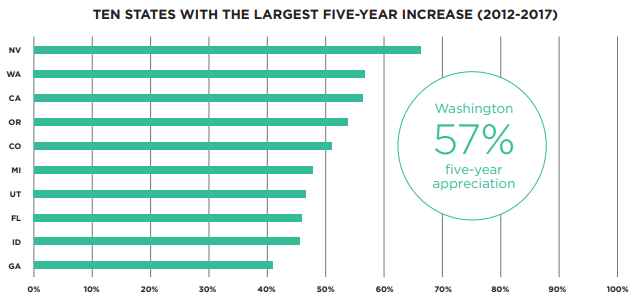
The states with the largest growth from trough-to-current home price levels align with those that fell the furthest during the crash. Nevada, Arizona, Michigan, California and Idaho, notably, appear in the top six states that experienced the greatest market declines. Nevada's price growth has been influenced by high demand and limited listings. California closely follows Nevada's growth at a 78 percent increase in home prices from its lowest dip, posing an ongoing affordability challenge to state residents in the home-buying market. California's booming technology industry may have helped the state recover from a 42 percent home price decline, boosting the average equity gained to $37,061.

Even thought they weren't among states hard hit by the recession, Washington and Oregon have joined California in experiencing significant appreciation over the last five years. In Washington that increase totals 57 percent and a $40,142 average equity gain. The state's gain comes largely from Seattle's growing technology industry and increases in land values. Oregon has seen a 54 percent increase and average equity is up by '$22,144.
CoreLogic said the entry of millennials into the housing market has driven increases in Utah and Colorado. In Utah only about 2 percent of homes remain underwater and the equity increase, $24,830, is about twice the national average. Colorado also has a 2 percent negative equity rate, with an average equity gain of $21,630 for the four quarters ended in Q3 2017.
In 2000 87 percent of the largest metro areas were considered by CoreLogic to be "at value," or at their long-run, sustainable levels, supported by local market fundamentals such as disposable income. By the time the market peaked in 2006, 65 percent were considered overvalued and only five, three in Michigan, one in Missouri, and one in Iowa, were considered undervalued. Together those five represented only 1 percent of the population of the large metro areas.
By the time the market bottomed out, only 27 markets - or 7 percent of the most populated metro areas - were listed as overvalued. The drop in home prices, which boosted affordability, coincided with other economic factors, a sharp drop in unemployment, and steady growth in the GDP, to trigger the beginning of the housing recovery. As of December 2017, the most populated metro areas in the U.S. remained at an almost even split between markets that are undervalued, overvalued and at value.

CoreLogic points out that, while some states have experienced a full pendulum swing from peak-to-trough and back to - or beyond - that peak, other regions have been slower to recover. Many that have seen outsized growth in housing prices, may still lag the nation in equity gains and like Miami, Las Vegas, and Chicago, still have high rates of negative equity.
California stands out with markets that recovered quickly and experienced the largest average equity growth per year. From the third quarter of 2016 to the third quarter of 2017, homes in the San Francisco metro area experienced an average equity gain of $73,217, while homes in the San Diego and Los Angeles metro areas gained $39,096 and $39,887, respectively. These numbers far exceeded the national average equity gain of $14,888.

Interestingly, only four of the 10 largest metros in the study - Washington D.C., Seattle, Austin and Denver - are considered overvalued. This indicates that despite the growth in home prices in metros like San Diego and Boston, other economic factors such as low unemployment, people choosing to rent, and access to high-paying jobs, have kept these regions within the normal range.


