
Two companies released home price data on Wednesday. CoreLogic released its Home Price Index (HPI) for the month of January while Lender Processing Services (LPS) released numbers for December.
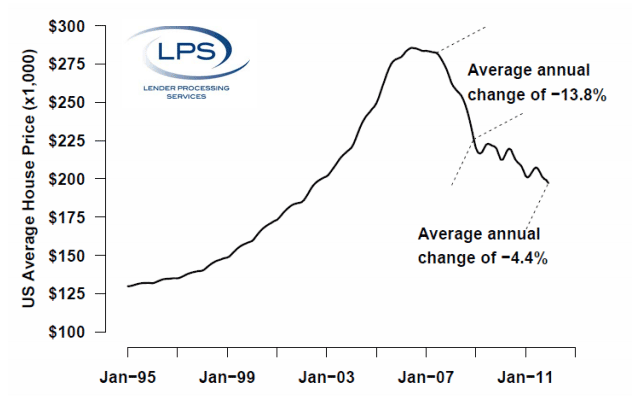
The LPS national HPI in December was the lowest since September 2002 with an average house price in December of $197,000, down $2,000 from the November number. December was the sixth consecutive month in which home prices declined and the actual decline of 1.0 percent was higher than the 0.8 percent that had been predicted. LPS is projecting a further decline in January to $195,000 or a -1.2 percent change.
While prices are still dropping, at least the rate of decline is less steep. During the period of most rapid decline - June 2007 to December 2008 - prices fell an average of 13.8 percent a year. Since then the annual rate has been 4.4 percent.
Aggregate home values are down 31 percent since the peak in June 2006, declining from $10.8 trillion to $7.5 trillion.
LPS said that December figures appear to have continued a seasonal pattern that has modulated prices since 2009. Seasonal variations seem to occur in the market for non-distressed home sales but short sales do not vary over the year nearly as much. Therefore the apparently significant seasonal effects that LPS and others have reported have been influenced by the large proportion of short sales after the bubble. These sales have been treated as if they experienced typical seasonal variations and thus have exaggerated seasonal price variations. LPS said that beginning next month it will institute updated HPI non-distressed sales which will even out the seasonal variations.
In 44 states all of the MSAs therein had price declines in December, a total of 373 of the 411 MSAs covered by LPS. Prices also fell in 28 MSAs in other states. Only Phoenix and Miami had average prices increases during December while San Francisco, San Diego, Detroit, Chicago, and Atlanta all had declines that exceeded 1.5 percent.
Raj Dosai, vice president of LPS said that despite the broad price declines since the bubble, not all MSAs have seen consistent price drops. "About one-fifth (89) of all the MSAs that LPS covers have seen average home prices increase since December 2008. For 90 percent of these MSAs, prices rose only as the lowest-priced homes in their markets rose. This correlation did not necessarily hold for higher-priced homes in those areas. Unfortunately, the MSAs that have seen price increases since December 2008 are generally small. Boston and Pittsburgh are exceptions."
CoreLogic tracks home sales including distressed sales (short sales and sales of lender owned real estate or REO.) Its HPI for January declined on a year-over-year basis by 3.1 percent and on a month-over-month basis by 1.0 percent, the sixth consecutive monthly decline. When distressed home sales are excluded the HPI narrows to a 0.9 percent decline year-over-year and there was a 0.7 percent increase in prices since December.
"Although home price declines are slowly improving and not far from the bottom, home prices are down to nearly the same levels as 10 years ago," said Mark Fleming, chief economist for CoreLogic.
States with the largest increase in HPI were South Dakota (+5.7 percent), North Dakota (+4.0 percent) and West Virginia (+4.0). When distressed sales are excluded the greatest increases were South Dakota (+6.4 percent), Montana (+5.9 percent) and North Dakota (+3.8 percent).
The largest depreciation in home prices was noted in Illinois (-8.7 percent), Nevada (-8.0 percent, and Delaware (-7.9 percent.) When distressed sales are not included the greatest depreciation was in Nevada (-6.7 percent), Delaware (5.5 percent), and Minnesota (-4.1 percent.)
Including distressed transactions, the peak-to-current change in the national HPI (from April 2006 to January 2012) was -34.0 percent. Excluding distressed transactions, the peak-to-current change in the HPI for the same period was -24.2 percent.


