
It is our first glance at home prices in the new year and CoreLogic estimates the rate of appreciation has fallen by more than 2 percentage points since January 2018. However, the company also predicts a small uptick in the rate of increase over the next 12 months.
CoreLogic's Home Price Insights report for January has an increase in its Home Price Index (HPI), which includes sales of distressed properties, of 0.1 percent from December 2018 to January and puts it 4.4 percent higher than the previous January. The HPI gained 6.6 percent in the 12 months that ended in January 2018.
The company's President and CEO Frank Martell said, "The slowing growth in home prices was inevitable in many respects as buyers pull back in the face of higher borrowing and ownership costs. As we head into 2019, we can expect continued strong employment growth and rising incomes which could support a reacceleration in home-price appreciation later this year."
The CoreLogic HPI Forecast indicates that home prices will increase by 4.6 percent on a year-over-year basis from January 2019 to January 2020. Prices are expected to decline 0.9 percent from January 2019 to January 2020.
The CoreLogic HPI Forecast is a projection of home prices using the CoreLogic HPI and other economic variables. Values are derived from state-level forecasts by weighting indices according to the number of owner-occupied households for each state.
CoreLogic holds in interest in the S&P Case-Shiller home price indices as well and the graph below shows a comparison of the national year-over-year percent change for the CoreLogic HPI and CoreLogic Case-Shiller Index from 2000 to the present month with forecasts one year into the future. Both indices are posting positive, but moderating year-over-year percent changes, and forecasting gains for the next year.

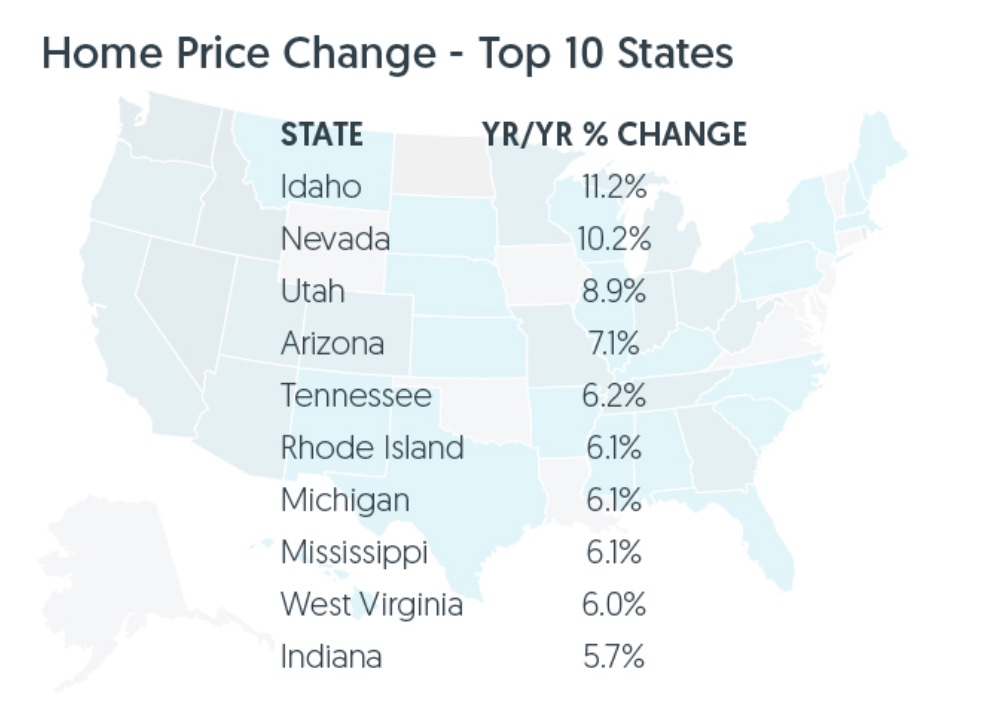
All states but Louisiana and North Dakota posted annual home price increases. The largest gains were Idaho (11.2%), Nevada (10.2%) and Utah (8.9%).
Las Vegas continued to lead metro areas with its 10.5 percent appreciation. Price growth has slowed substantially in other former high-flying areas. San Francisco, for example, posted a 1.6 percent annual increase and San Diego prices were up 2.2 percent.
CoreLogic analyzed the country's 100 largest metropolitan areas based on housing stock and found 35 percent of cities to be overvalued as of January 2019 using the company's Market Conditions Indicators (MCI) data. Their analysis defines an overvalued housing market as one in which home prices are at least 10 percent higher than the long-term, sustainable level supported by local market fundamentals such as disposable income. An undervalued housing market is one in which home prices are at least 10 percent below the sustainable level. The current analysis also found 27 percent to be undervalued and 38 percent at value. When looking at only the top 50 markets based on housing stock, 40 percent were overvalued, 18 percent were undervalued, and 42 percent were at value.
Frank Nothaft, CoreLogic's Chief Economist said of the January report, "The spike in mortgage interest rates last fall chilled buyer activity and led to a slowdown in home sales and price growth. Fixed-rate mortgage rates have dropped 0.6 percentage points since November 2018 and today are lower than they were a year ago. With interest rates at this level, we expect a solid home-buying season this spring."


