
It seems that taxes on real property reflect not only the value of the property itself, but also how long the owner has held title. That was one finding of a study released this week by RealtyTrac, which it called its 'first-ever U.S. Property Tax Rates Report."
Property taxes are assessed and collected on local levels, usually counties but in some areas by towns. The revenue generally funds local government, roads, public safety and with the largest single expenditure generally going to the public schools. Localities use different methods for assessing valuations which results in difficulty comparing taxes among localities and sometimes even with the house next door.
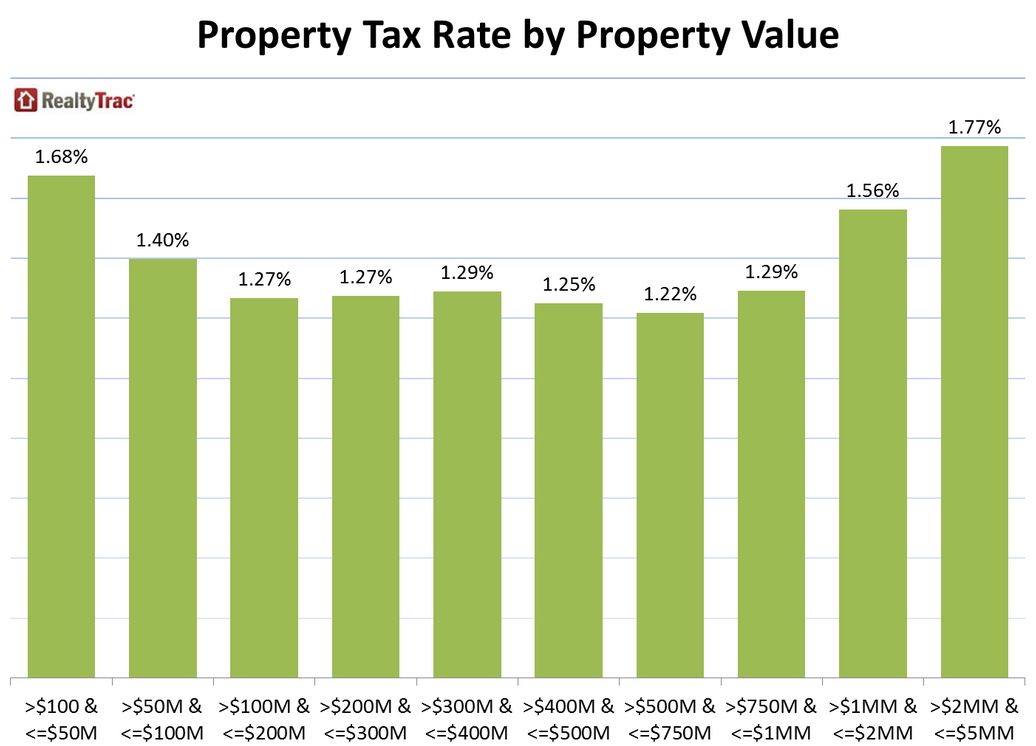
RealtyTrac cut the data in several ways and came up with some interesting findings. First, it found that owners of very high end and very low end homes pay the highest property tax rates. The average effective property tax rate (average taxes on a single family home in 2014 divided by the average estimated value of the home) was 1.29 percent. Where a home had a market value of $50,000 or less, the rate was 1.68 percent and for those valued between $50,000 and $100,000 it was 1.40. As seen in the chart below, when property values rose above $100,000 the rate dropped below 1.30 percent and stayed there until values hit $1 million. Then the rate climbed, reaching 1.77 percent for properties over $2 million in value.
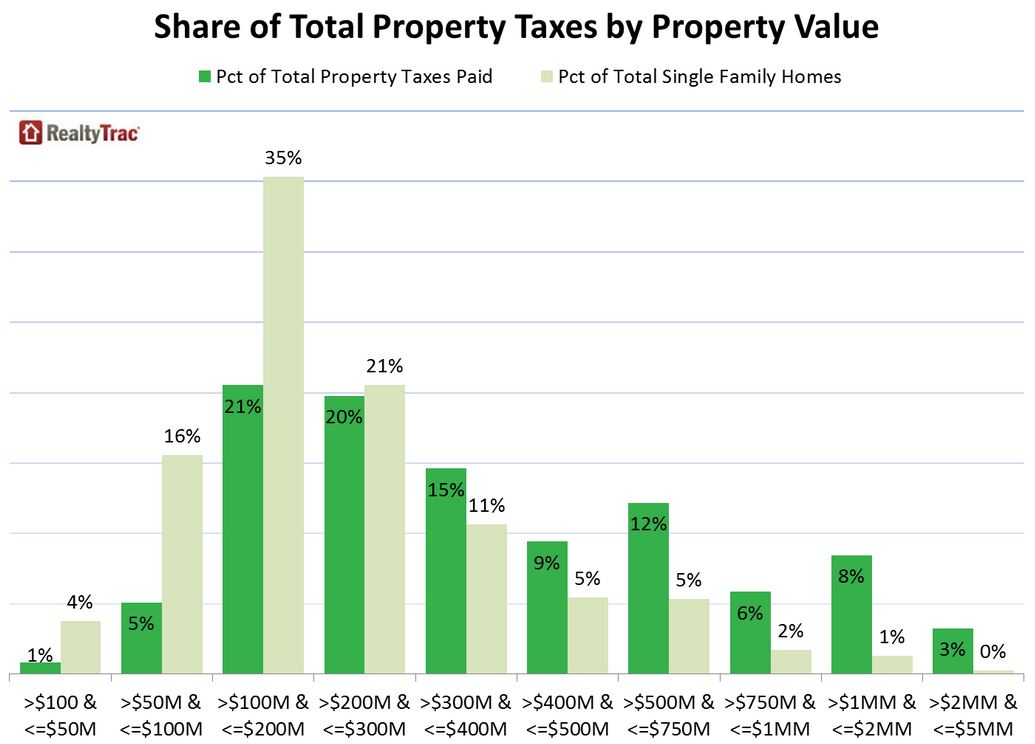
Despite the mid-level rate of taxes, the 25 percent of homes valued above $300,000 were responsible for 54 percent of taxes paid nationwide while the homes under $300,000 accounted for 75 percent of the housing stock but paid only 46 percent of taxes.
Rates varied widely among states and over the 1,000 plus counties studied by RealtyTrac. The state with the highest effective tax rate was New York at 3.01 percent followed by Texas (2.8 percent), Illinois (2.15 percent), Connecticut (2.11 percent), and New Jersey (2.01 percent.) At the other end were Alabama (0.40 percent), Wyoming (0.55 percent), Colorado (0.55 percent), West Virginia (0.60 percent) and Tennessee (0.64 percent).
The counties with the highest tax rate were Westchester County, New York at 7.53 percent, Bexar County, Texas (San Antonio), 3.32 percent, and DeKalb County (Chicago, 3.27 percent.
Where rates and values collide the result is some pretty impressive tax bills. The average in Westchester County was $56,124 with the second highest average in New York County at $38,573. Third, fourth, and fifth places weren't even close: Nassau County, New York, $11,587, Marin County, California, $11,422; and Bergen County, New Jersey, $11,159.
The report found significant correlation between years owned and tax rate. The average effective property tax rate was 1.35 percent for homeowners who have owned between 10 and 15 years, and it was 1.34 percent for homeowners who have owned between 5 and 10 years. Meanwhile, the average effective property tax rate was 1.18 percent for homeowners who have owned less than 1 year, and it was 1.15 percent for homeowners who have owned more than 20 years.
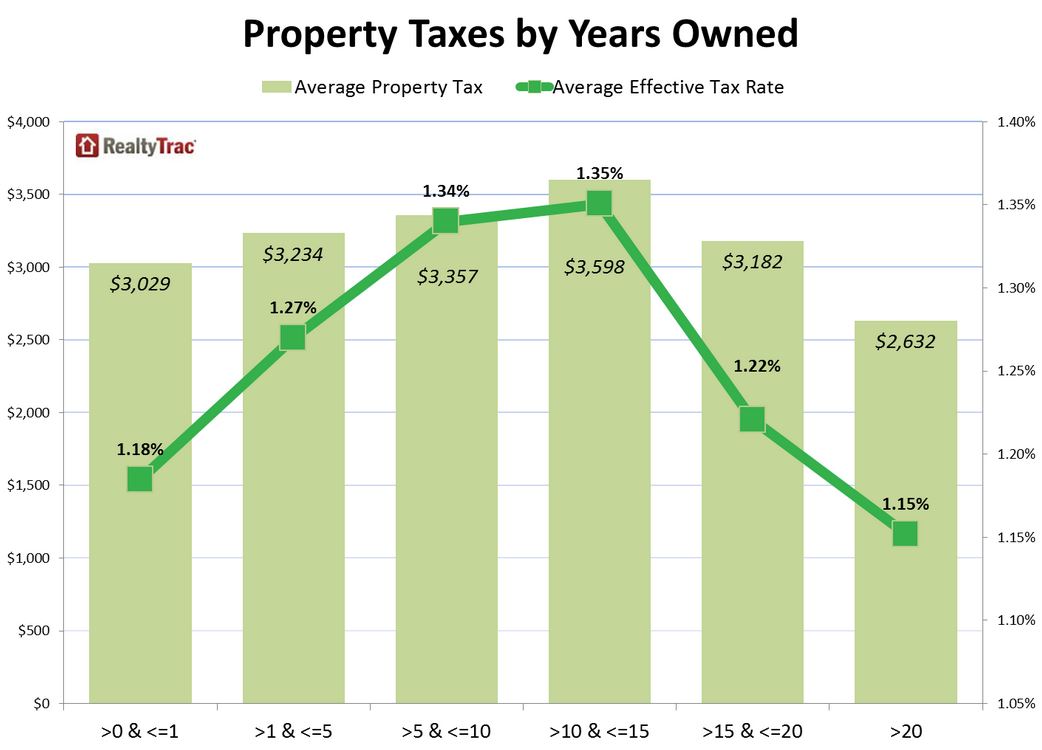
"State laws like Prop 13 in California give a property tax advantage to homeowners who have owned for a longer time, but the bell curve in effective property tax rates in the middle of the years-owned spectrum indicates that many who purchased during the housing bubble - or in the years leading up to the housing bubble - may be paying taxes based on a still-inflated valuation of their properties," said Daren Blomquist, vice president at RealtyTrac. "These homeowners should consider appealing their property's assessment if that is an option available to them in their county."


