
The Census Bureau and Commerce Department have released Construction Spending data for January 2011.
Residential construction spending includes remodeling, additions, and major replacements to owner occupied properties subsequent to completion of original building. It includes construction of additional housing units in existing residential structures, finishing of basements and attics, modernization of kitchens, bathrooms, etc. Also included are improvements outside of residential structures, such as the addition of swimming pools and garages, and replacement of major equipment items such as water heaters, furnaces and central air-conditioners. Maintenance and repair work is not included.
READ MORE ABOUT DATA COLLECTION
Construction Spending data reports on the sum of the value of work done on all construction projects underway during the period, regardless of when work on each individual project was started or when payment was made to the contractors. For some categories, published estimates represent payments made during a period rather than the value of work actually done during that period. For other categories, estimates are derived by distributing the total construction cost of the project by means of historic construction progress patterns.
The “value of construction put in place” is a measure of the value of construction installed or erected at the site during a given period. For an individual project, this includes—
- Cost of materials installed or erected.
- Cost of labor (both by contractors and force account) and a proportionate share of the cost of construction equipment rental.
- Contractor’s profit.
- Cost of architectural and engineering work.
- Miscellaneous overhead and office costs chargeable to the project on the owner’s books.
- Interest and taxes paid during construction (except for state and locally owned projects).
Projects are classified as privately owned or government owned (state, local, or federal government). The distinction is made on the basis of ownership during the construction period.
Reuters Quick Recap...
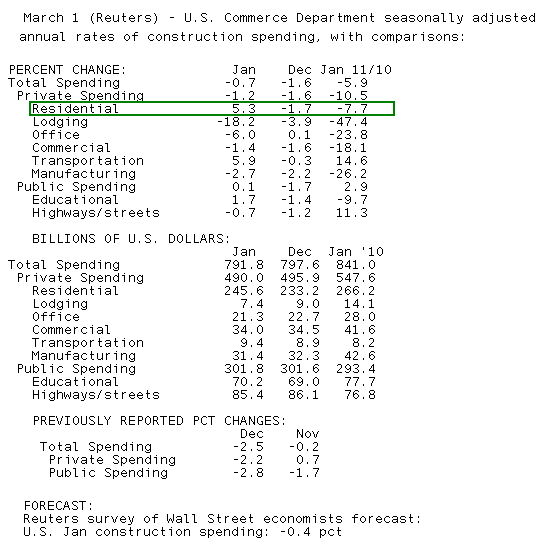
RTRS-US JAN CONSTRUCTION SPENDING -0.7 PCT (CONSENSUS -0.4 PCT) TO $791.82 BLN VS DEC -1.6 PCT (PREV -2.5 PCT)
RTRS-US JAN PRIVATE CONSTRUCTION SPENDING -1.2 PCT, PUBLIC SPENDING +0.1 PCT
RTRS-US JAN PRIVATE NONRESIDENTIAL CONSTRUCTION SPENDING LOWEST SINCE AUG 2004
RTRS-TABLE-U.S. Jan construction spending falls 0.7 pct
Excerpts from the Release....
The U.S. Census Bureau of the Department of Commerce announced today that construction spending during January 2011 was estimated at a seasonally adjusted annual rate of $791.8 billion, 0.7 percent (±1.4%)*
PUBLIC CONSTRUCTION
In January, the estimated seasonally
adjusted annual rate of public construction spending was $301.8 billion,
0.1 percent (±2.1%)* above the revised December estimate of $301.6
billion. Educational construction was at a seasonally adjusted annual
rate of $70.2 billion, 1.7 percent (±3.2%)* above the revised December
estimate of $69.0 billion. Highway construction was at a seasonally
adjusted annual rate of $85.4 billion, 0.7 percent (±6.2%)* below the
revised December estimate of $86.1 billion.below the revised December estimate of $797.6 billion. The January figure is 5.9 percent (±1.8%) below the January 2010 estimate of $841.0 billion.
PRIVATE CONSTRUCTION
Spending on private construction was at a seasonally adjusted annual rate of $490.0 billion, 1.2 percent (±1.1%) below the revised December estimate of $495.9 billion.
Nonresidential construction was at a seasonally adjusted annual rate of $244.4 billion in January, 6.9 percent (±1.1%) below the revised December estimate of $262.7 billion. Residential construction was at a seasonally adjusted annual rate of $245.6 billion in January, 5.3 percent (±1.3%) above the revised December estimate of $233.2 billion.
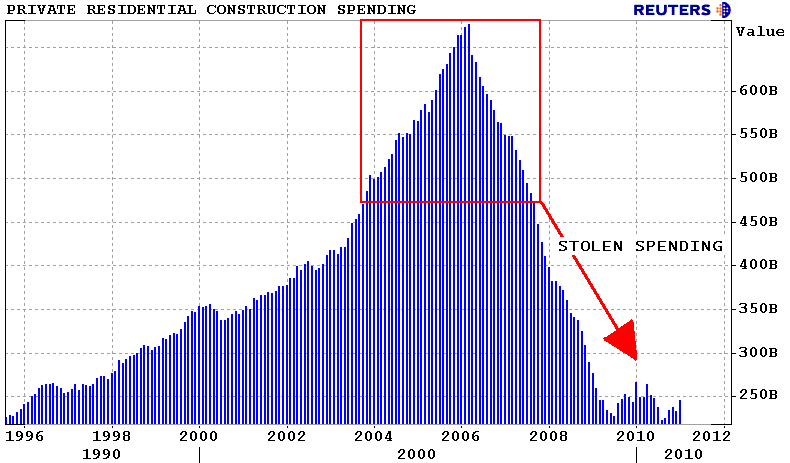
Plain and Simple: Private Non-Residential Spending contracted at an annualized rate of 6.9 percent in January. This is the lowest level of private nonresidential spending since August 2004 and the largest source of weakness in the broader spending report. Private Residential Construction Spending improved at an annualized rate of 5.3 percent in January. As you can see in the chart above, private residential spending in the mid-2000s rose at an unsustainable pace and consequently stole demand from future generations in the process. Now we're seeing a stagnation in the new residential construction market as a result. While we are not excited about the single-family building outlook, we would expect spending on multi-family residential structures to expand as private investors attempt to fill housing rising demand for rental units. We would also expect to see renovation spending increase as private investors rebuild the glut of dilapidated foreclosed inventory on the housing market.


