The share of cash-out refinances spiked in 2017 and 2018 in a manner similar to what happened just before the Great Recession. The share jumped to 50 percent in 2017 and 61 percent in 2018, the highest since 2006. In two posts in CoreLogic's Insights blog however Arthur Jobe maintains that the current surge is nothing like that earlier one. They differ by credit quality, dollar volume, and borrower characteristics and therefore present much less risk this time around.
The volume of both cash-out and non-cash-out loans increased in 2015 and 2016 as borrowers enjoyed a two-year window when decreasing interest rates and continued home-price growth offered ideal conditions for refinancing. In 2014, when the spike in cash-out refinances started, the volume had fallen to a 17-year low. Jobe says that then, when interest rates increased in 2017, the number of rate/term originations dropped by nearly 50 percent while the volume of cash-out loans decreased by about 8 percent, causing a spike in the latter despite the decrease in volume. Cash-outs merely became a larger slice of a smaller pie.

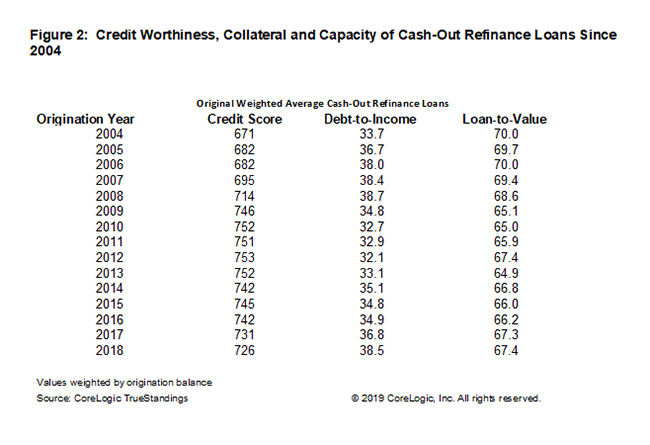
Volume, the author says, is the largest differentiator between the recent spike and the one in 2004 through 2006. CoreLogic data shows that the volume of cash-out refis has fallen sharply since 2005, and the total volume of cash-out originations between 2015 and 2018 was roughly one-fourth the volume originated between 2003 and 2006. That decline means the number of outstanding loans has fallen to less than 80 percent of the number in 2008. This lowers the lender and investor portfolio exposure to cash-out mortgages.
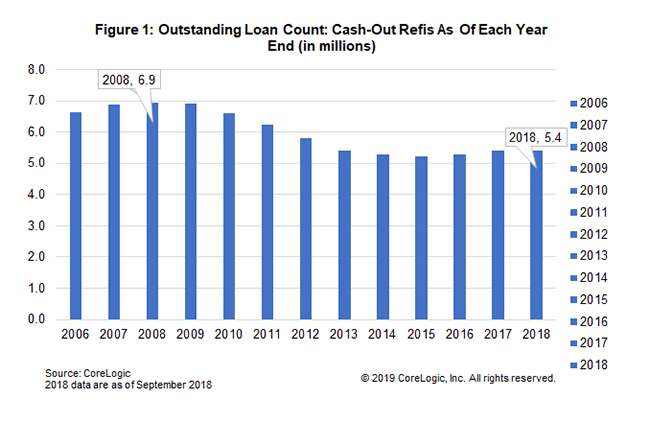
Lenders and investors also have less to fear because of the credit quality of the cash-out portion of refinancing. When measured by the "3 C's" of mortgage underwriting - credit worthiness, collateral value and capacity to pay - the quality of originations in the last few years has improved since the earlier period. The first-lien loan-to-value (LTV) ratio has declined from 70 between 2004 and 2006 to 67 while the average debt-to-income ratio is about the same. Credit scores however are much higher. The weighted average FICO score for loans originated between 2017 and 2018 is roughly 729 compared to 678 for loans originated between 2004 and 2006. The earlier period also had widespread use of second liens, raising the combined first- and second-lien loan-to-value even higher than today.
Recent cash-out borrowers have also exhibited less risky behavior, as seen by the decrease in repeat cash-out borrowers. At the end of 2008, 1.9 million households, or 28 percent of the 6.9 million households with an active cash-out mortgage, had refinanced with cash-out at least once before. By last September those serial refinancings had dropped to 1.4 million, or 26 percent, of the 5.4 million total. There was also a longer interval between their transactions. In 2006 the average time between consecutive refinancings was less than two years. That has steadily grown, 3.2 years in 2018.