
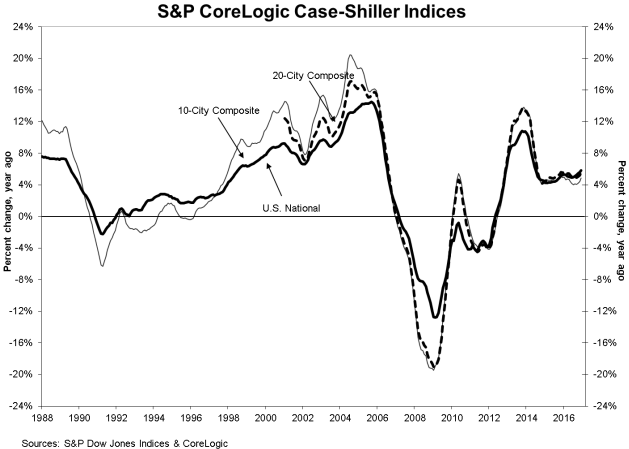
Home prices accelerated their growth again in December. The S&P CoreLogic Case-Shiller U.S. National Home Price NSA Index, which covers all nine U.S. census divisions, rose by 5.8 percent compared to one year earlier. In November the gain over the previous 12 months was 5.6 percent. The year-over-year increase has been larger each month since July and Case-Shiller called the annual December number the largest increase in 30 months. On a monthly basis, the National Index rose 0.2 percent before seasonal adjustment and was up 0.7 percent after.
The 10-City Composite Index rose 4.9 percent on an annual basis compared to 4.4 percent in November while the 20-City Composite reported a year-over-year gain of 5.6 percent, up from 5.2 percent in November. Among the 20 cities the largest annual gains were again registered in Seattle, Portland, and Denver. Seattle led the way with a 10.8 percent year-over-year price increase in December, followed by Portland with 10.0 percent, and Denver at 8.9 percent. Twelve cities reported greater price increases in the year ending December 2016 versus the year ending November 2016. Both the city composites rose 0.3 percent on a non-adjusted basis and 0.9 percent after adjustment.
Analysts were on the low side with their predictions for the 20-City Composite. Those polled by Econoday were looking for an 0.7 percent monthly gain and the same 5.6 percent as had occurred in November.
Case-Shiller says that an analysis of prices in Portland and Seattle, which have alternated in first and second place as price increase leaders, show that, over the course of 2016, prices in the highest tier, over $532,716 for Seattle and $411,335 for Portland, to be the most stable while those in the lowest tier, (under $335,111 and $296,361) are the most volatile.
David M. Blitzer, Managing Director and Chairman of the Index Committee, provided the following analysis.
"Home prices continue to advance, with the national average rising faster than at any time in the last two-and-a-half years. With all 20 cities seeing prices rise over the last year, questions about whether this is a normal housing market or if prices could be heading for a fall are natural. In comparing current home price movements to history, it is necessary to adjust for inflation. Consumer prices are higher today than 20 or 30 years ago, while the inflation rate is lower. Looking at real or inflation adjusted home prices based on the S&P CoreLogic Case-Shiller National Index and the Consumer Price Index, the annual increase in home prices is currently 3.8 percent. Since 1975, the average pace is 1.3 percent; about two-thirds of the time, the rate is between -4 percent and +7 percent. Home prices are rising, but the speed is not alarming.
"One factor behind rising home prices is low inventory. While sales of existing single family homes passed five million units at annual rates in January, the highest since 2007, the inventory of homes for sales remains quite low with a 3.6-month supply. New home sales at 555,000 in 2016 are up from recent years but remain below the average pace of 700,000 per year since 1990. Another factor supporting rising home prices is mortgage rates. A 30-year fixed rate mortgage today is 4.2 percent compared to the 6.4 percent average since 1990. Another indicator that home price levels are normal can be seen in the charts of Seattle and Portland OR. In the boom-bust of 2005-2009, prices of low, medium, and high-tier homes moved together, while in other periods, including now, the tiers experienced different patterns."
As of December, average home prices in the 10-City and 20-City Composites have returned to their winter 2007 levels but remain below their summer of 2006 peaks by 8.8 percent in the case of the 10-City and 6.7 percent for the 20-City. The National Index has now surpassed its 2006 high point by 0.5 percent.
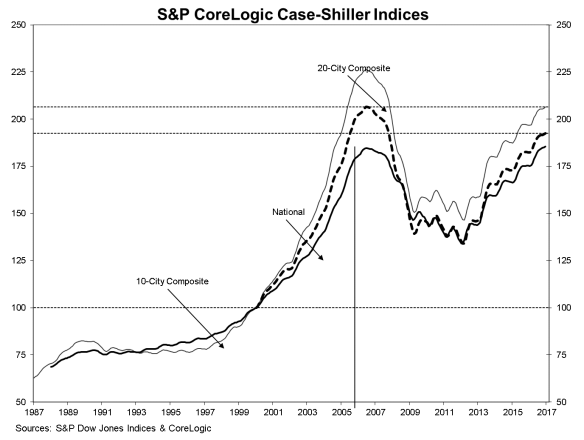
The S&P CoreLogic Case-Shiller Home Price Indices are constructed to accurately track the price path of typical single-family home pairs for thousands of individual houses from the available universe of arms-length sales data. The National U.S. Home Price Index tracks the value of single-family housing within the United States. The indices have a base value of 100 in January 2000; thus, for example, a current index value of 150 translates to a 50 percent appreciation rate since January 2000 for a typical home located within the subject market.
The National Index in December was at 185.54 compared to 185.23 in November. The 10- and 20-City Composites had readings of 206.45 and 192.61 respectively. Los Angeles has the highest index reading at 253.13 and Detroit the lowest at 109.83, representing a slight decline from November.


