
Both the S&P CoreLogic Case-Shiller home price indices and the Federal Housing Finance Agency's (FHFA's) House Price Index (HPI) for December provide more evidence that low interest rates have reignited the fire under home price appreciation.
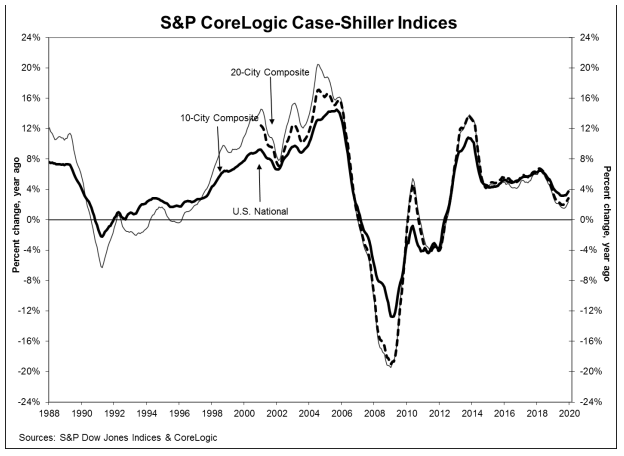
Case-Shiller's National Home Price Index, covering all nine U.S. census divisions, reported a 3.8 percent annual gain in December, up from 3.5 percent in the previous month. The 10-City Composite annual increase came in at 2.4 percent, up from 2.0 percent in in November, and the 20-City Composite jumped from a 2.5 percent gain the prior month to 2.9 percent.
On a monthly basis the National Index rose 0.1 percent on an unadjusted basis and was 0.5 percent higher when seasonally adjusted Both of the city composites were unchanged before seasonal adjustment and both rose 0.4 percent afterward. Ten of the 20 cities tracked saw price gains on an unadjusted basis while all but one posted increases afterward.
Phoenix, Charlotte, and Tampa continue to be the cities with the highest degree of annual appreciation.
Phoenix led with year-over-year growth of 6.5 percent, followed by Charlotte with 5.3 percent and Tampa at 5.2 percent. Twelve of the 20 cities reported greater price increases in the year ending December 2019 versus the year ending November 2019.
"At a regional level, Phoenix retains the top spot for the seventh consecutive month, with a gain of 6.5 percent for December. Charlotte and Tampa rose by 5.3 percent and 5.2 percent respectively, leading the Southeast region. The Southeast has led all regions for the past year.
"As was the case last month, after a long period of decelerating price increases, the National, 10-City, and 20-City Composites all rose at a faster rate in December than they had done in November; 12 of our 20 cities likewise saw accelerating prices. It is, of course, too soon to say whether this marks an end to the deceleration or is merely a pause in the longer-term trend."
"The U.S. housing market continued its trend of stable growth in December," says Craig J. Lazzara, Managing Director and Global Head of Index Investment Strategy at S&P Dow Jones Indices. "December's results bring the National Composite Index to a 3.8 percent increase for calendar 2019. This marks eight consecutive years of increasing housing prices (an increase which is echoed in our 10- and 20-City Composites). At the national level, home prices are 59 percent above the trough reached in February 2012, and 15 percent above their pre-financial crisis peak. Results for 2019 were broad-based, with gains in every city in our 20-City Composite.
In addition to the 15.2 percent increase over the previous peak noted by Lazzara, both city composites have also exceeded their 2006 peaks. The 20-Citiy is up 5.9 percent and the 10-City by 2.3 percent.
FHFA said its HPI rose 0.6 percent from November to December, tripling its October to November gains. The December monthly increase accounted for nearly half of the 1.3 percent appreciation in the fourth quarter. Annual appreciation in December was 5.1 percent compared to 4.9 percent the previous month. U.S. house prices have now risen for 34 consecutive quarters started in September 2011.
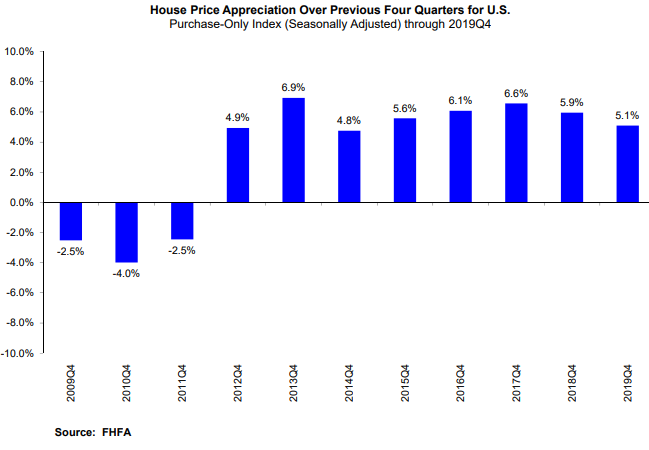
"Growth in U.S. home prices stabilized at the end of 2019 with fourth quarter prices increasing 5.1 percent from the same period a year ago. The revised measure of home price growth in the third quarter was also 5.1 percent. Prices in the Mountain region had the highest gains, posting a 6.7 annual growth rate in the fourth quarter," according to Dr. Lynn Fisher, Deputy Director of the Division of Research and Statistics at FHFA.
Prices were up in every state and in the District of Columbia between the fourth quarters of 2018 and
2019. Appreciation was greatest in Idaho at 12.0 percent followed by Utah at 8.1 percent, Arizona, Washington, and Indiana, all with 7.0 percent gains. Prices were also up in 97 of the nation's largest metro areas.
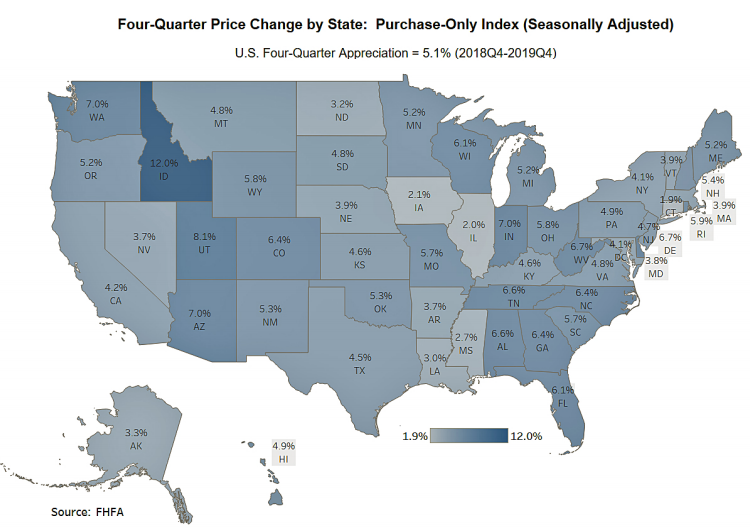
Of the nine census divisions, the Mountain division experienced the strongest four-quarter growth, posting a 6.7 percent gain. Prices were weakest in the New England Division, rising only 3.9 percent.
The S&P CoreLogic Case-Shiller Home Price Indices are constructed to accurately track the price path of typical single-family home pairs for thousands of individual houses from the available universe of arms-length sales data. The National U.S. Home Price Index tracks the value of single-family housing within the United States. The indices have a base value of 100 in January 2000; thus, for example, a current index value of 150 translates to a 50 percent appreciation rate since January 2000 for a typical home located within the subject market.
As of November 2019, the National Index was at 212.59 up from 212.56 in October. The 10- and 20-City Composites had readings of 231.55 and 218.73 respectively, compared to 231.45 and 218.68 the prior month. Los Angeles has the highest index at 289.15 and Cleveland the lowest at 126.72.
FHFA reports prices based on purchase mortgages acquired by the GSEs Fannie Mae and Freddie Mac. The HPI was benchmarked to 100 in January 1991. The November 2019 reading was 283.0.


