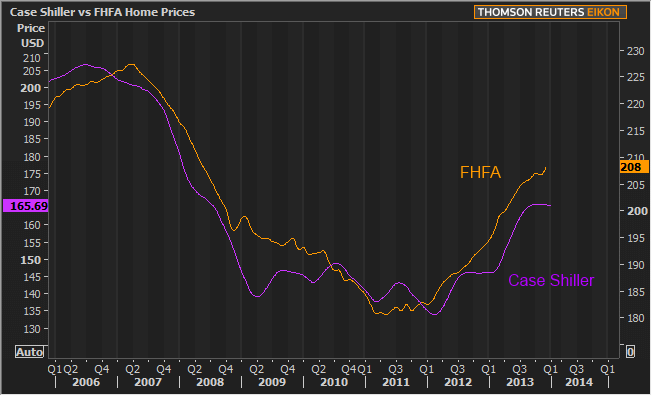
The S&P Case-Shiller National home price index and the Federal Housing Finance Agency's Home Price Index (HPI), both issued on Tuesday, diverged sharply on the direction of home prices during the fourth quarter of 2013. The FHFA HPI shows an increase of 1.2 percent compared to the third quarter while Case-Shiller's National number moved in the opposite direction.

The Case-Shiller index of National home prices, a quarterly index which covers all nine U.S. census divisions, rose 11.3 percent from the fourth quarter of 2012, a slight improvement over the 11.2 percent annual increase in the third quarter of 2013. However the fourth quarter index was down 0.3 percent from that third quarter level.
The Case-Shiller 10- and 20-City Composite Indices were flat in December with the 10-City unchanged and the 20-City posting its second small monthly decline of 0.1 percent. The two indices still posted healthy annual gains of 13.6 percent and 13.4 percent respectively although these increases were about 30 basis points below the annual gains reported in November.
David M. Blitzer, Chairman of the Index Committee at S&P Dow Jones said this was the best year for the index since 2005. "However, gains are slowing from month-to-month and the strongest part of the recovery in home values may be over. Year-over-year values for the two monthly Composites weakened and the quarterly National Index barely improved. The seasonally adjusted data also exhibits some softness and loss of momentum."
Despite the flat composite results a few cities still pulled out month-over-month increases especially Miami which shot up 0.9 percent. Las Vegas rose 0.4 percent and Tampa 0.3 percent. Los Angeles, San Francisco, and Washington all posted gains of 0.2 percent. The largest monthly declines were in Cleveland (-1.2 percent), Minneapolis (-0.7 percent), Chicago (-0.5 percent), and Phoenix and New York (-0.3 percent).
Thirteen of the 20 cities in the composite indices had double digit annual appreciation led by Las Vegas at 25.5 percent and San Francisco at 22.6 percent. Prices rose 20.3 percent in Los Angles and 18 percent in Atlanta and San Diego. The smallest annual increases among the 20 cities were in Cleveland (4.5 percent), New York (6.3 percent) and Charlotte (7.8 percent)
"Recent economic reports suggest a bleaker picture for housing, "Blitzer said. "Existing home sales fell 5.1 percent in January from December to the slowest pace in over a year. Permits for new residential construction and housing starts were both down and below expectations. Some of the weakness reflects the cold weather in much of the country. However higher home prices and mortgage rates are taking a toll on affordability."
Case-Shiller says that home prices are back to spring 2004 levels and measured from their June/July 2006 peaks the two composites are still down about 20 percent. Their recovery from March 2012 lows is 23-24 percent.
The 1.2 percent quarterly increase in its HPI reported by FHFA was the tenth consecutive quarterly increase. Principal Economist Andrew Leventis said, "Home price appreciation in the fourth quarter was considerable, but more modest than in recent periods. It is too early to know whether the lower quarterly growth rate represents the beginning of more normalized price appreciation patterns or a more significant slowdown."
The seasonally adjusted, purchase only HPI rose 7.7 percent from the fourth quarter of 2012 to the fourth quarter of 2013. The cost of other goods and services were up only 0.7 percent over the same period, therefore inflation adjusted home prices were up 7.0 percent. Prices in December rose 0.8 percent compared to November.
FHFA's expanded-data price index, a measure that adds transaction information from county recorders and the Federal Housing Administration to the FHFA information, rose 1.2 percent from the previous quarter as well and was up 7.8 percent from the 4th quarter of 2012.
The seasonally adjusted, purchase-only HPI rose in 38 states in the fourth quarter, down from 48 states in the third quarter. Nevada, California, Arizona, Oregon, and Florida posted the largest annual gains.
Two of the nine census regions, New England, and the Middle Atlantic, had monthly decreases (-0.5 and -0.6 respectively) in their HPI. The largest increase was in the West South Central region which was up 2.0 percent, and the East South Central, up 1.6 percent. All nine regions posted increases on an annual basis with the smallest rise in the Middle Atlantic at 2.1 percent followed by New England at 2.7 percent. The largest jumps in the HPI were in the Pacific and Mountain Regions at 14.9 percent and 12.6 percent respectively.
The S&P Case Shiller indices combine matched price pairs for thousands of individual arms-length sales transactions with a value-weighted average of the cities in each index. The composites have a base value of 100 in January 2000, thus a current index value of 150 translates to a 50 percent appreciation rate since that date for a typical home in the subject market. As of December only Detroit remains below the base with an index of 93.63. The FHFA HPI is based on data for more than 6 million repeat sales transactions financed with Fannie Mae or Freddie Mac mortgages.


