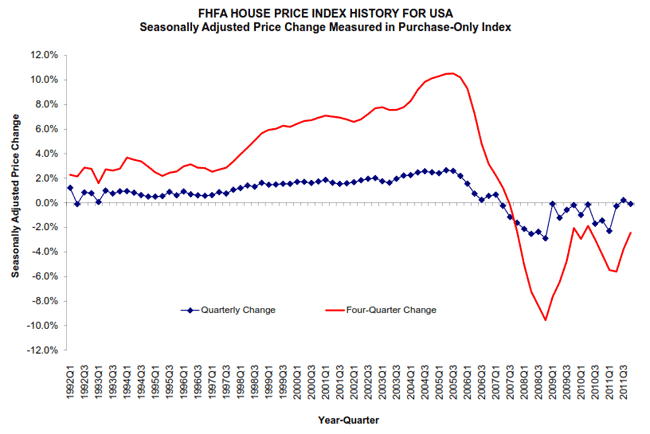
While the Federal Housing Finance Agency's (FHFA) purchase only House Price Index (HPI) was down slightly in the fourth quarter, data for December indicates that the situation may have begun to reverse. Fourth quarter figures released Thursday show that the HPI decreased 0.1 percent on a seasonally adjusted basis from the third quarter and 1.1 percent on an unadjusted basis. However the monthly data released at the same time show that December prices increased 0.7 percent from November on an adjusted basis and were flat on an unadjusted basis.
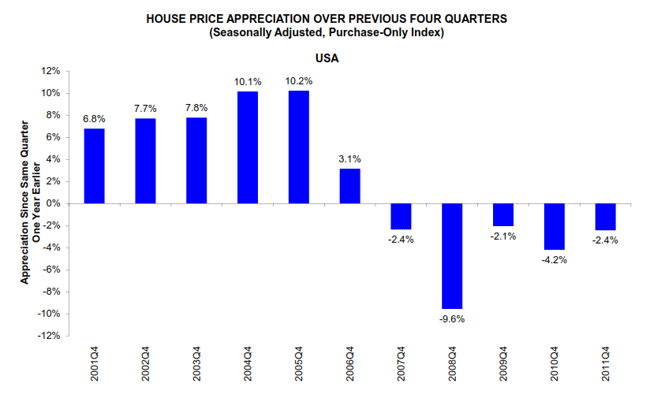
The HPI fell 2.4 percent on an annual basis from the level in Q4 2010. FHFA said that during the same period the cost of other goods and services rose 4.0 percent so the inflation adjusted price of homes fell approximately 6.2 percent over the four quarters of 2011.
There were, however, bright spots. FHFA Principal Economist Andrew Leventis pointed out that over the previous four quarters 12 states and the District of Columbia posted price increases. "When coupled with the fact that about half of all U.S. states saw price increases in the latest quarter, this growth adds to mounting evidence that real estate markets are seeing at least some signs of life," he said.
Every census division also posted a positive change from November to December except the West North Central division which was down 0.9 percent. The greatest appreciation was in the Mountain division where the December HPI was up 2.5 percent.
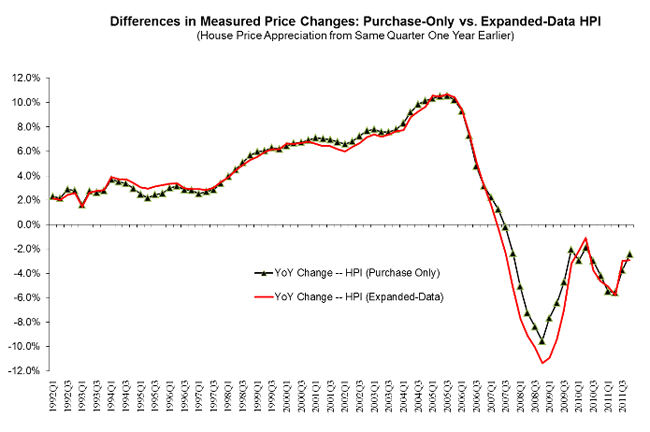
The HPI is based on the combined mortgage records of Fannie Mae and Freddie Mac and tracks repeat sales of the same property. Last August FHFA began publishing an "expanded-data" HPI which adds transaction information from country recorder officers and the Federal Housing Administration's (FHA) database. This index fell 0.8 percent over the latest quarter and 2.9 percent over the four quarters it has been in use.
FHFA notes that the trend of the two data-bases are generally the same, but the purchase-only index has exhibited more modest price declines over the last four quarters, having dropped 2.4 percent vs. 2.9 percent in the expanded series. It should be noted, however, that many of the differences between the two series on the state level were quite significant.
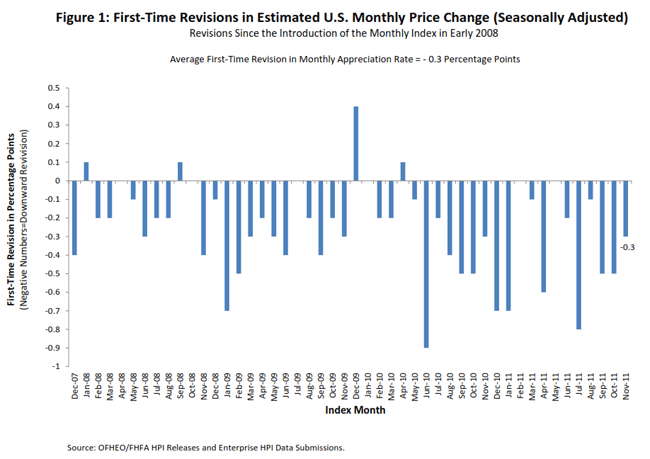
The current report includes information on a study done by FHFA to investigate an anomaly in the data over time. Each monthly and quarterly report is given as an estimate subject to revision and it has been noted that such revisions have tended to be negative. This has been viewed as reasonable since data from Freddie and Fannie comes in on a rolling basis and hence the estimate has a bias toward the earlier part of the reporting period while revisions pick up more data from the end of the period. In a period of declining prices, data at the end of the period would tend to reflect lower prices than data from the beginning. However over the last year, even as prices have flattened, these negative revisions have persisted.
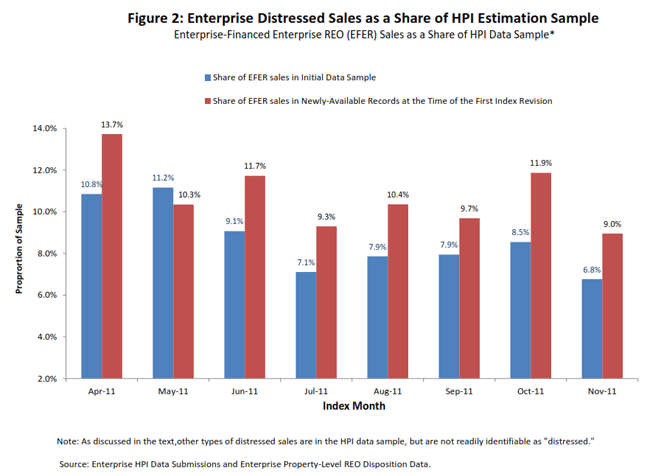
Statisticians began to wonder if there might be a feature of distressed sales that were contributing to the phenomena. Was there, for some reason, a delay in reporting these transactions which do tend to be discounted and thus could impact the revisions? There was no way to identify private sales where the seller was distressed or bank sales of REO, but FHFA could flag sales of REO sold and also financed by Freddie Mac and Fannie Mae.
Estimated data for November resulted in an HPI that reflected an increase of 1.0 percent. When that data was revised the following month there was a downward revision to +0.7 percent. When the distressed property theory was tested against the data it was found that "new data" for November did, in fact, include a relatively large share of Enterprise-Financed Enterprise-REO (EFER). When the November data was first estimated EFER transactions accounted for roughly 6.6 percent of the sample. The November originated mortgages that subsequently became available included roughly 9 percent EFER sales. Working backward through April it was found that old and new samples contained EFER sales in roughly those same amounts.
FHFA said that while these two or three percent changes in the sample seem small, given the REO discounts involved, an average of 10 percent, they could be having a material impact on index estimates, especially if other distressed sales have a similar lag before entering the system.