
It seems every data source in the housing industry has its own definition of affordability, most using a mortgage payment to income ratio based on median home prices and median incomes. While the National Association of Home Builders (NAHB) has an index that follows this profile, it has recently been rolling out its Priced-Out Estimates for the current year. These look at affordability from a slightly different perspective, showing how fragile affordability really is.
In a series of articles in its Eye on Housing blog, various NAHB analysts run through combinations of scenarios to determine how many households lose the ability to buy a home as home prices rise or interest rates go up.
The NAHB estimates require a household income distribution along with some standard assumptions about the costs of shelter. These include a 10 percent down payment, an annual private mortgage insurance premium of 73 basis points, a property tax rate of $11 and an annual payment for homeowner's insurance of $4, per $1,000 of property value. NAHB then applies the conventional underwriting standard that these costs should not exceed 28 percent of household income. The result is a housing affordability pyramid like the one shown below:
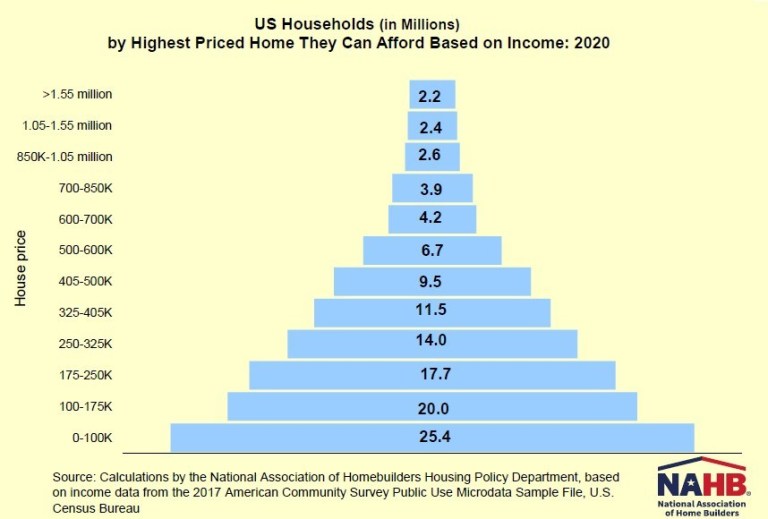
At the bottom of the pyramid are over 25 million households which lack the income to afford a $100,000 home. Within the bottom three tiers there is a total of 63 million - or more than half of roughly 120 households, who can't afford a $250,000 home, giving credence to a NAHB finding last fall that 49 percent of home buyers are seeking homes below that price level. NAHB estimates that a $1,000 increase in the median price of new home will price 158,857 households out of the market. These are borrowers who could qualify for a mortgage to purchase the home before the price increase, but not afterward.
The number of priced out households varies across both states and metropolitan areas, with larger states naturally having larger priced out populations. Among all the states, Texas registered the largest priced out effects that a $1,000 home price increase could push 14,143 households out of the market, followed by Florida (10,274), and California (8,870).
The ability of a household to buy a home is similarly affected when interest rates rise. Starting with a new home at the estimated median price of $345,908 and a mortgage rate of 3.75 percent, slightly higher than Freddie Mac reported this week, each quarter-point increase could put ownership of a median priced new home out of reach for more than 1.3 million households.
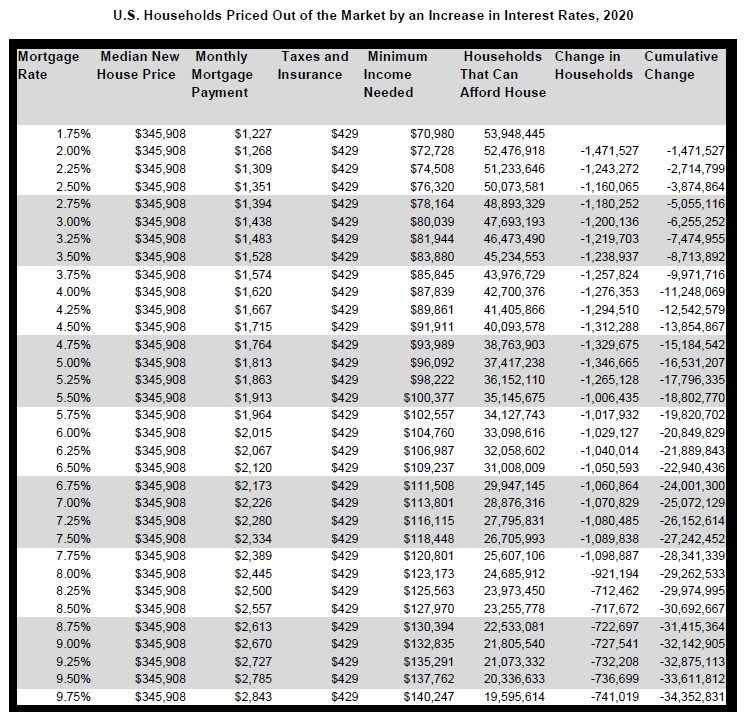
Of course this works in reverse and NAHB points out the excellent example of "pricing in" from very recent history. In late 2018 the 30-year fixed rate was about 4.75 percent, and about 38.8 million households were, at that point, priced out of the market for a median-priced new home. After the Federal Reserve reversed its monetary policy to one of easing in 2019, rates dropped a full point and about 5.2 million additional households were theoretically able to qualify for a home by the beginning of this year.


