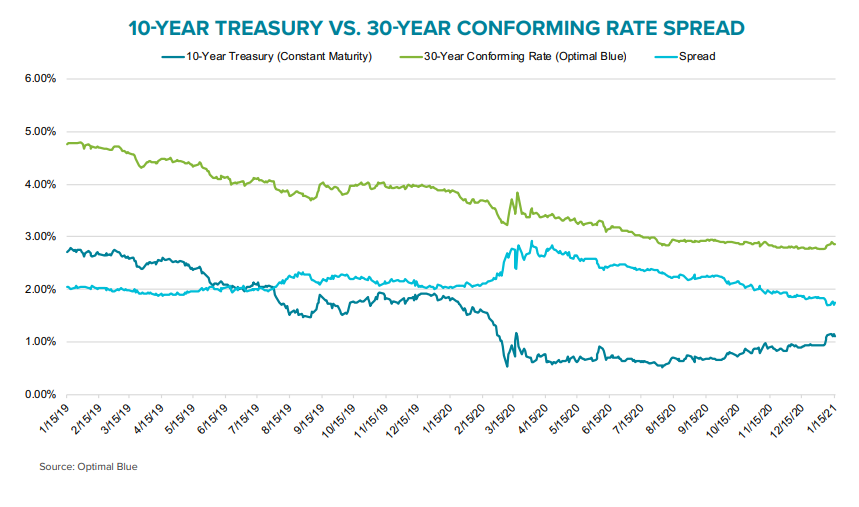
The current Mortgage Monitor from Black Knight looks at the recent small increases in mortgage rates and their potential impact on home sales. The company says that Treasury yields have been rising with the 10-year up nearly 0.25 percent just since the January 5 Georgia senatorial runoff. While the spread between it and the 30-year mortgage rates absorbed part of the increase, mortgages did subsequently rise by about 1/8th of a point. The January spike wasn't an isolated event, the 10-year yield had eased up 40 basis points over the last five months of 2020. "Should yields rise further in coming months, they may begin to impact 30-year rates more directly, although the Fed's bond buying efforts are expected to insulate the mortgage market to some degree," the report says.
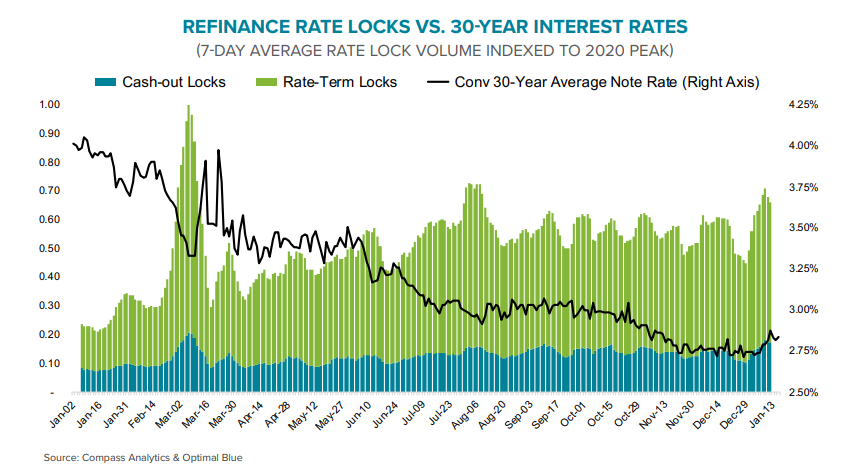
The 1/8th point growth of the 30-year rate doesn't appear to have discouraged lending. Black Knight says rate lock activity remains strong with those tied to refinancing rising 10 percent during the first 15 days of January and are up 90 percent from the same period in 2020. This would make the January activity one of the strongest periods since the refinance boom kicked off early last year. Purchase rates locks also remain strong with double digit gains year-over-year.
Rising rates and recent refinancing activity has caused some moderation of refinancing incentive. The number of homeowners able to qualify for and benefit from refinancing (saving at least 75 basis points on a new loan) declined to 16.7 million on January 14 from 18.7 million at the start of the year. Even so, the refinancing pool is still down only 14 percent from its record high point in mid-December. The average refinancing candidate could still save $303 a month; an aggregate of $5.2 billion per month if everyone took advantage of the opportunity.
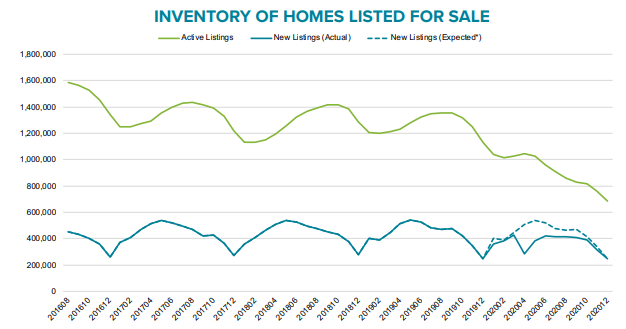
The supply of available homes for sale continues to shrink. The number of listings is down 450,000 units or 40 percent compared to last year. Black Knight says that even without considering the slight downward trend in new listings in recent years, it appears that more than 750,000 homeowners chose to forego listing their homes for sale (-16 percent) due to the pandemic. Most (470,000 missing listings) came in the second quarter of 2020. By December new listings had caught up with those a year earlier but even if listing volumes are normalizing, it will leave a significant deficit unless buyer demand also moderates.
The low interest rates and even lower supply of homes is continuing to put upward pressure on home prices. Black Knight puts the annual rate of increase in December at an astonishing 15.7 percent, caping a three-month run of growth exceeding 15 percent (October, 15.8 percent and November, 16.2 percent.) The only other month that this has occurred was in August 2005 with a 15.9 percent gain.
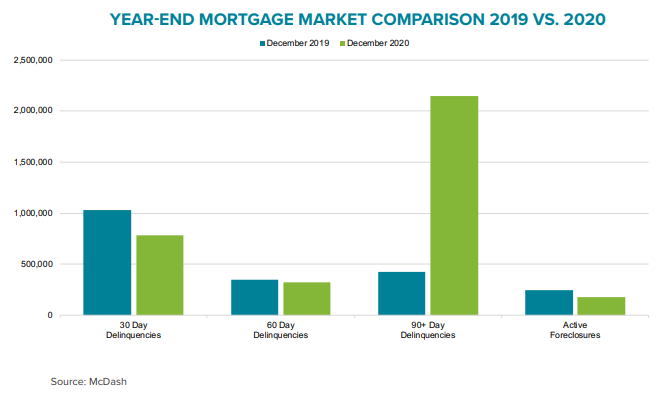
Black Knight updates the status of COVID-19 related forbearance plans each week, but the current Monitor takes a comprehensive look at those plans, delinquencies, and foreclosures at the end of 2020.
The national delinquency rate fell 3.09 percent in December to 6.08 percent and serious delinquencies fell to 3.43 million from 3.56 percent the previous month. The company says that nearly 40 percent of the spike in delinquencies early in the pandemic has been reversed, however, serious delinquencies (90 days or more) associated with the pandemic are down only 11 percent. The number of loans rolling from current to 30 days past due returned to pre-pandemic levels in July and continue to remain lower on an annual basis. That, however, is not true of later stage delinquencies. The number of loans transitioning from 30 to 60 days past due was up 34 percent year-over-year in the 4th quarter and 60-to-90-day transitions are more than double those in 2019. Ninety-day defaults rose by more than 250 percent to 2.6 million, the third largest default total on the record and the largest since 2009. With foreclosures down 67 percent from 2019 because of moratoriums, the number of seriously delinquent borrowers increased by 400 percent to 2.15 million compared to December 2019.
With the current steady but small improvement in overall delinquencies, the national rate could remain elevated for another 17 months and it would take nearly five more years for serious delinquencies to return to pre-pandemic levels. By the end of March, there could be nearly 1.5-1.6 million excess seriously delinquent mortgages in the market.
And March is important because, without further government action, almost a quarter of all homeowners in forbearance will hit their 12th month and final plan expiration. At that point, Black Knight says, we could likely see an inflection point, with post forbearance waterfalls helping to get borrowers back on track with a combination of deferrals, repayment plans, and loan modifications.
Black Knight Data & Analytics President Ben Graboske says, "When nearly a quarter of all forbearance plans come to an end on March 31, at the current rate of improvement there would still be approximately 1.5 million more such serious delinquencies than before the pandemic. With that rate of improvement slowing in recent weeks, current trends suggest more than 2.5 million homeowners would still in forbearance at that point. While early in the pandemic roughly half of homeowners in forbearance continued to make their monthly mortgage payments, that number has steadily declined. Today, it's about 12 percent, which suggests the people who are taking the full forbearance period afforded to them may well be experiencing prolonged financial distress and face extended challenges as they return to making payments.
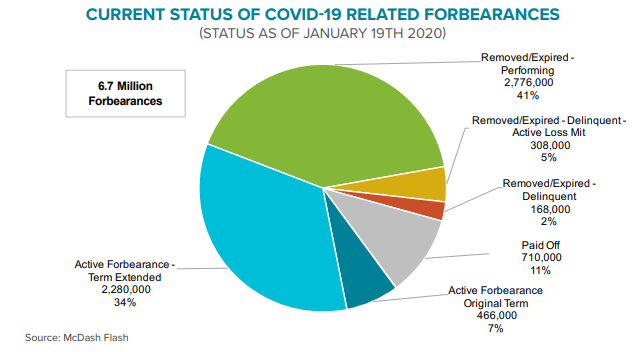
"For the roughly 6.7 million Americans who have been in COVID-19 related mortgage forbearance at some point since the onset of the pandemic, the programs have represented an essential lifeline," said Graboske. "The vast majority of plans have a 12-month cap on payment forbearance, though. And the various moratoriums which have kept foreclosure actions at bay over the past 10 months may be lulling us into a false sense of security about the scope of the post-forbearance problem we will need to confront come the end of March. Last year saw the largest number of homeowners - nearly 3.6 million - become 90 or more days past due since 2009, and as of the end of December, 2.1 million remained so.
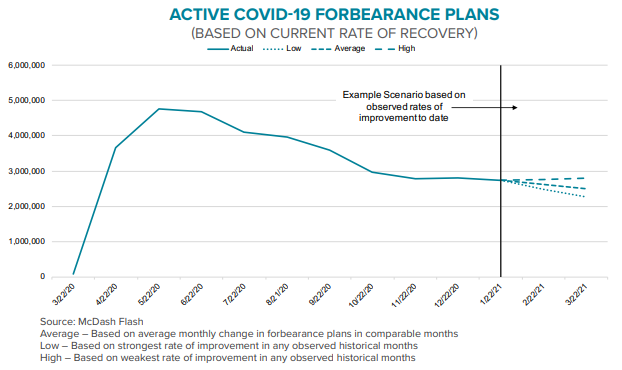
Over the past 30 days removals from plans have slowed to about one in four of removals and extensions, well below the 40 percent average for the life of the program. Looking at example scenarios of active forbearance volumes based on the best, worst and average improvement of the recovery period (June 2020 - January 2021), the rate of improvement to date, could mean there would 2.5 million to 2.8 million active forbearance plans remaining at the end of March. That works out to more than 600K seriously delinquent mortgages that will move into post-forbearance loss modification waterfalls as they work to get back to current on their mortgages. Another 300K+ borrowers will reach the end of their terms at the end of April. Of course, performance could be outside either the high or low end of these estimates, but the trend has been toward the "high" scenario.
Of the 6.7 million homeowners who were in forbearance plans at some point over the last 10 months, 1.8 million were past due on their mortgages before the program started, the remainder were current. There have been significant differences in the performance of the two groups. Sixty-five percent of the 4.9 million who were current at the beginning have left their plans and 59 percent are either performing or have paid their mortgages in full. Only 2 percent are currently past due and in loss mitigation. Of the pre-pandemic delinquent borrowers, only 45 percent have left plans; 26 percent are reperforming and 6 percent have paid off their loans. Six percent have left forbearance, remain delinquent, and at risk of foreclosure when moratoriums expire.
The chart below shows that status of all forbearances as of January 19, 2020.