
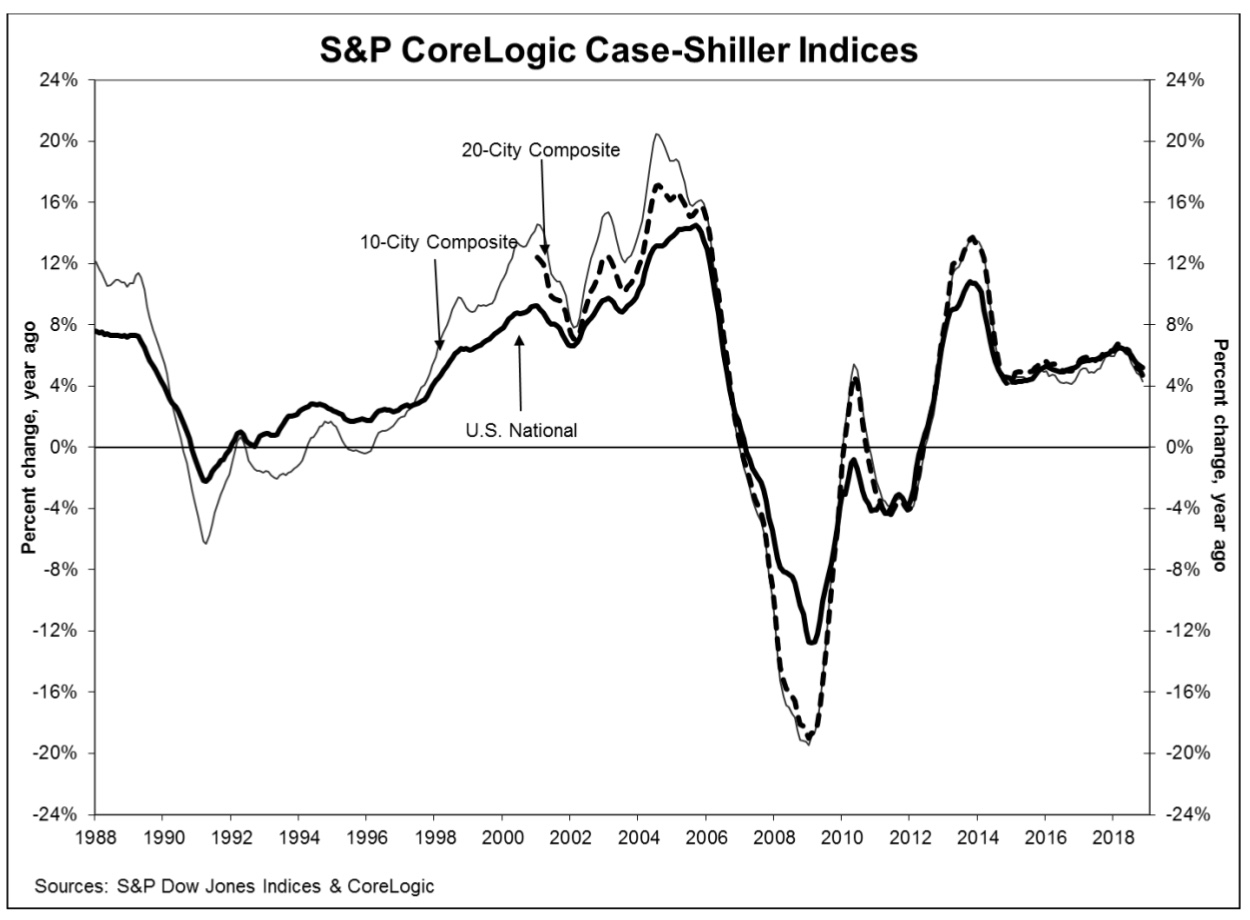
The pace of home price increases slowed a little more in November. The non-seasonally adjusted (NSA) S&P CoreLogic Case-Shiller U.S. National Home Price Index which covers all nine U.S. census divisions, reported a 5.2 percent annual gain in November, down from 5.3 percent annual appreciation in October. On a month-over-month basis the NSA National Index rose 0.1 percent and after seasonal adjusted gained 0.4 percent
The deceleration was more apparent in the two composite indices. The annual increase in the 10-City Composite dropped from 4.7 percent in October to 4.3 percent while the 20-City slowed to 4.7 percent from 5.0 percent. The composites turned negative on a non-adjusted month-over-month basis; each declined 0.1 percent. After seasonal adjustment both the 10-City and 20-City were up 0.3 percent. Eight of the 20 cities reported increases before adjustment, 15 afterward.
Las Vegas, Phoenix and Seattle continue to report the largest annual gains among cities tracked by the indices. Las Vegas led the way with a 12.0% year-over-year price increase, followed by Phoenix at 8.1 percent. Seattle remains in the top three with annual appreciation of 6.3 percent, but this is a significant change from November 2018 when it led the list at 12.7 percent. Seven of the 20 cities reported greater price increases in the year ending November 2018 versus the year ending October 2018.
David M. Blitzer, Managing Director and Chairman of the Index Committee at S&P Dow Jones Indices provided the following analysis. "Home prices are still rising, but more slowly than in recent months," he said. "The pace of price increases are being dampened by declining sales of existing homes and weaker affordability. Sales peaked in November 2017 and drifted down through 2018. Affordability reflects higher prices and increased mortgage rates through much of last year. Following a shift in Fed policy in December, mortgage rates backed off to about 4.45 percent from 4.95 percent.
"Housing market conditions are mixed while analysts' comments express concerns that housing is weakening and could affect the broader economy. Current low inventories of homes for sale - about a four-month supply - are supporting home prices. New home construction trends, like sales of existing homes, peaked in late 2017 and are flat to down since then. Stable 2 percent inflation, continued employment growth, and rising wages are all favorable. Measures of consumer debt and debt service do not suggest any immediate problems."
The S&P CoreLogic Case-Shiller Home Price Indices are constructed to accurately track the price path of typical single-family home pairs for thousands of individual houses from the available universe of arms-length sales data. The National U.S. Home Price Index tracks the value of single-family housing within the United States. The indices have a base value of 100 in January 2000; thus, for example, a current index value of 150 translates to a 50 percent appreciation rate since January 2000 for a typical home located within the subject market.
As of November 2018, average home prices for the MSAs within the 10-City and 20-City Composites are back to their winter 2007 levels and retreated slightly from their October levels. The National Index was at 205.83, down from 206.03 in October. The 10- and 20-City Composites had readings of 227.42 and 213.66 respectively. Los Angeles claims the highest index at 281.99. Cleveland had the lowest reading at 122.93


