
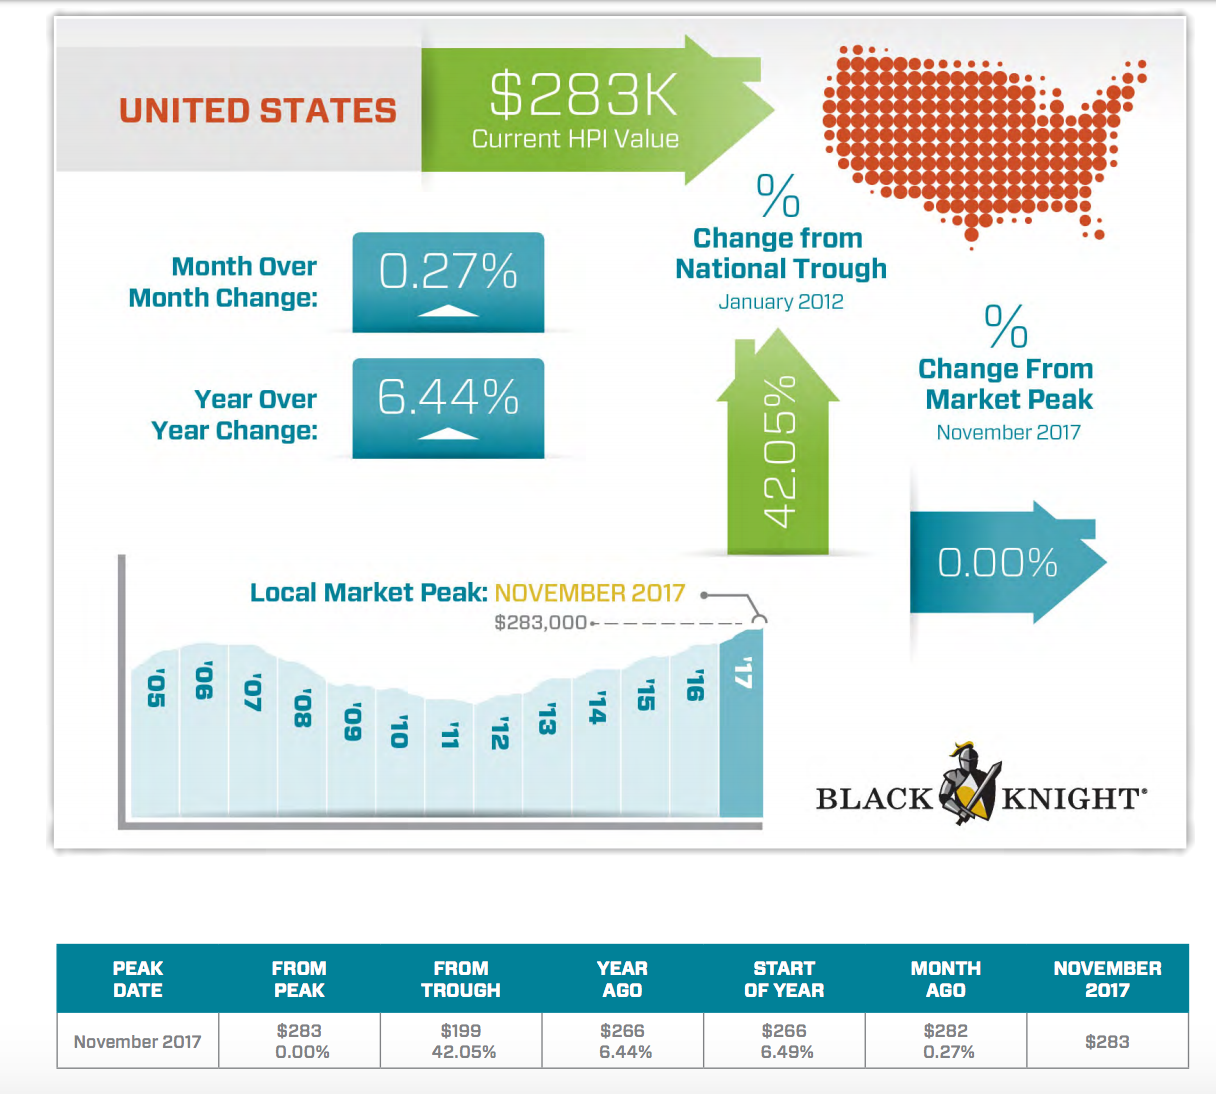
Home prices measured by Black Knight's Home Price Index (HPI) achieved their 67th consecutive year-over year increase in November. The HPI rose 6.44 percent in the 12 months ending in November 2017, only a shade lower than the annual increase of 6.48 posted in October. November's appreciation brought the nation's home prices to a new peak, $283,000.
Monthly appreciation held relatively steady at 0.27 percent. This was a slight slowing from the October to November increase of 0.29 percent.
Over the first 11 months of 2017 the average annual change was 6.84 percent and the aggregate price gain since the beginning of 2017 is 6.49 percent. Over the same period, monthly gains, which see-sawed over a range of 0.1 percent to 1.3 percent averaged 0.61 percent per month.
For the fifth consecutive month New York was the leader in appreciation among all states, and the gain from October to November was significantly ahead of all other states, 1.36 percent. Second-place Nevada trailed with an 0.76 percent increase followed by Vermont, Arizona, and Utah with price hikes in the low to mid 60 percent range.
Speaking of Nevada, arguably one of the states hit hardest by the housing crisis, it has recently been staging one of the stronger price gains. In its largest city, Las Vegas, home prices were up almost 13 percent year-over-year in November and have risen by 93 percent from the market bottom. But Black Knight points out, it is still off its 2006 peak by 25 percent.
Among the 20 largest states, six saw prices drop. Wisconsin had the largest loss, 0.37 percent, followed by Ohio, 0.31 percent; North Dakota, 0.26 percent, and Connecticut, 0.22 percent.
Dover, Delaware led all metropolitan areas with prices climbing more than 2.1 percent from October. It, along with San Jose and Santa Rosa, were the only three states among the top ten metro areas not located in either New York or Florida.
On the other side of that coin, Canton, Ohio saw its prices plummet by 2.24 percent, the largest loss among all metropolitan areas.
Eleven of the nation's 20 largest states hit new peaks in October as did 12 of the 40 largest metro areas.
The Black Knight HPI utilizes repeat sales data from the nation's largest public records data set, as well as its own loan-level mortgage performance data, to produce measures of home prices for both disclosure and non-disclosure states. Non-disclosure states do not include property sales price information as part of their publicly available county recorder data.


