
No matter how much it is predicted, home price gains are still failing to decelerate. All three of the S&P/Case-Shiller indices were slightly higher on an annual basis in November than they were in October and the Federal Housing Finance Agency's (FHFA's) Home Price Index (HPI) recorded a greater year-over-year increase in November 2015 than it did in November 2014.
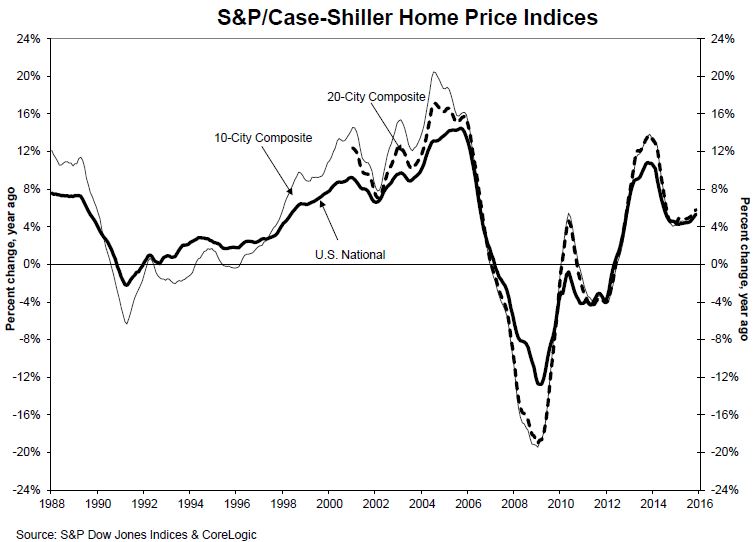
The S&P/Case Shiller U.S. National Home Price Index, covering all nine U.S. census divisions rose 5.3 percent in November compared to 5.1 percent in October. The Case-Shiller 10-City Composite posted a 5.3 percent increase compared to a 12 month gain of 5.0 percent in October while the 20-City Composite was up 5.8 percent versus 5.5 percent the previous month.
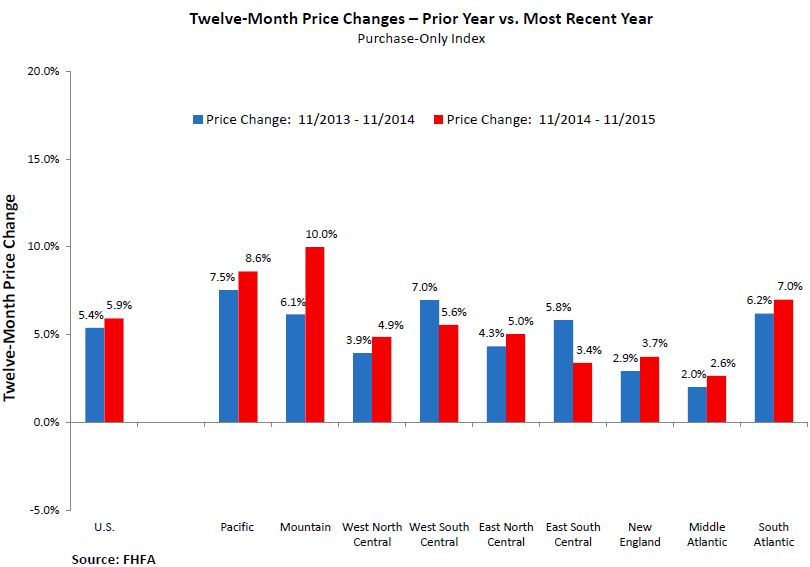
FHFA reported home prices rose 5.9 percent on a seasonally adjusted annual basis. The annual increase a year earlier was 5.4 percent.
Case-Shiller reported the highest annual increases were again in Portland, San Francisco, and Denver; prices in all three rose by double digits. Portland was up 11.1 percent, San Francisco 11.0, and Denver 10.9 percent. Fourteen cities reported higher annual price gains in November than in October while Phoenix extended its streak of 12-month increases to a full year. Even beleaguered Detroit improved, posting a 6.3 percent annual gain compared to 5.1 percent in October.
The three Case Shiller indices also rose significantly month-over-month on a seasonally adjusted basis, each rising 0.9 percent compared to October. On a non-seasonally adjusted basis the National Index was up 0.1 percent as was the 20-City composite while the 10-City was unchanged. Fourteen of the 20 cities tracked by the indices had monthly increases before seasonal adjustment; all improved on an adjusted basis.
David M. Blitzer, Managing Director and Chairman of the S&P Dow Jones Index Committee said, "Home prices extended their gains, supported by continued low mortgage rates, tight supplies and an improving labor market. Sales of existing homes were up 6.5 percent in 2015 vs. 2014, and the number of homes on the market averaged about a 4.8 months' supply during the year; both numbers suggest a seller's market. The consumer portion of the economy is doing well; like housing, automobile sales were quite strong last year. Other parts of the economy are not faring as well. Businesses in the oil and energy sectors are suffering from the 75% drop in oil prices in the last 18 months. Moreover, the strong U.S. dollar is slowing exports. Housing is not large enough to offset all of these weak spots.
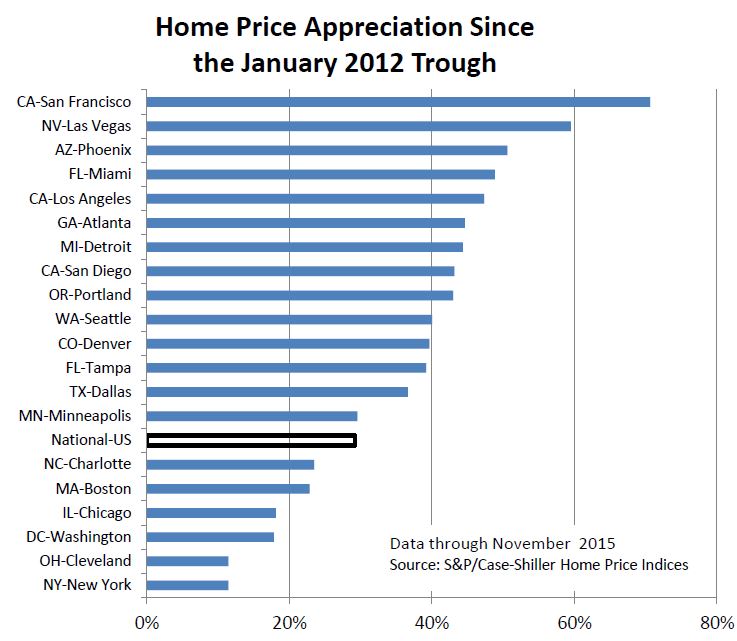
"Home prices continue to recover from the collapse that began before the recession of 2007-2009 and continued until 2012. Three cities - Dallas, Denver and Portland, Oregon - have reached new all-time highs; San Francisco is even with its earlier peak and Charlotte, North Carolina is less than one percent below its previous peak. The S&P/Case-Shiller National Home Price Index is about 4.8 percent below the peak it set in July 2006, and 29.2 percent above the bottom it touched in January 2012. By comparison, the S&P 500 as of Friday, January 22nd is up 46 percent from January 2012 - better than the S&P/Case-Shiller National Home Price series and about the same as Los Angeles. The chart shows how far the 20 cities have rebounded from the National Index bottom."
The S&P/Case-Shiller Home Price Indices are constructed to accurately track the price path of typical single-family home pairs for thousands of individual houses from the available universe of arms-length sales data. The S&P/Case-Shiller National U.S. Home Price Index tracks the value of single-family housing within the United States. The indices have a base value of 100 in January 2000; thus, for example, a current index value of 150 translates to a 50 percent appreciation rate since January 2000 for a typical home located within the subject market.
The 10-City Composite currently has an index level of 197.54 and the 20-City a value of 182.86. The National Index is at 175.71. Detroit has the lowest index value at 103.40 and Los Angeles has the highest at 239.83.
FHFA's national HPI for November was up 0.5 compared to October on a seasonally adjusted basis, the same percentage increase as posted from September to October. Six of the nine census divisions had increases, the highest, in the Mountain Division, was 1.8 percent while the largest loss was in the West South Central division at 0.4 percent.
All nine divisions were in positive territory on an annual basis with the largest increase again in the Mountain division at 10.0 percent and the Middle Atlantic division with the smallest gain at 2.6 percent. In seven of the nine divisions the annual increases in November were higher than those a year earlier.
The FHFA monthly HPI is calculated using home sales price information from mortgages sold to, or guaranteed by, Fannie Mae and Freddie Mac.


