
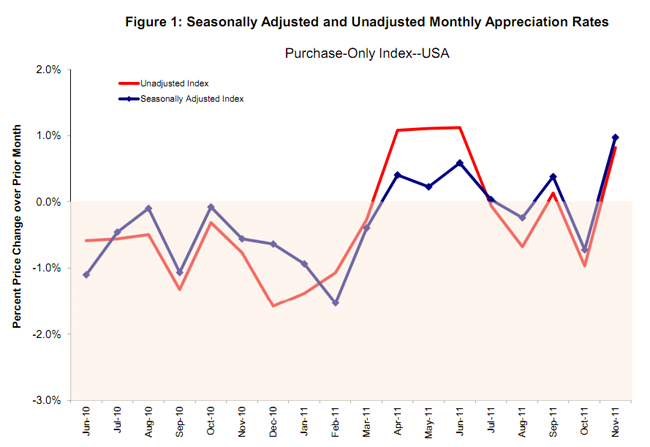
The Federal Housing Finance Agency's (FHFA) Home Price Index (HPI) rose 1.0 percent from October to November reflecting an increase in U.S. housing prices on a seasonally adjusted basis. As can be seen in the figure below, the there is little difference between seasonally adjusted and unadjusted FHFA figures. The estimated figure for October was revised down from a -0.2 change as first reported to -0.7. The current index is 183.8 a drop of 1.8 percent from November 2010 when the index was at 187.3.

The current HPI is 18.8 percent below the peak it reached in April 2007 and indicates that prices have returned to roughly the same range as existed in February 2004.
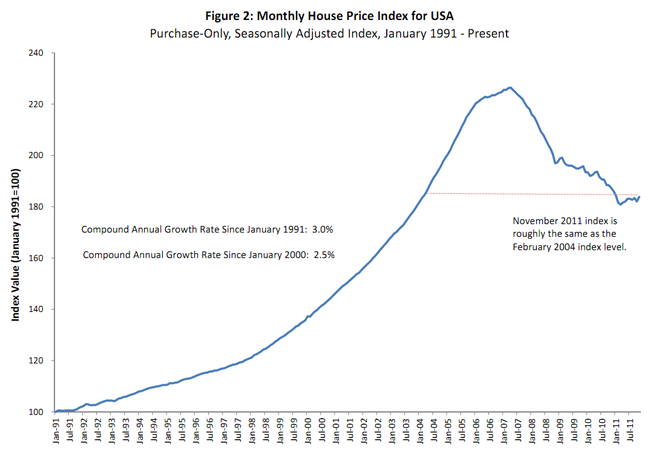
The HPI is calculated using purchase prices of houses with mortgages that have been sold to or guaranteed by Freddie Mac or Fannie Mac. The index is based on 100 representing prices for homes in the first quarter of 1991.
The HPI rose for all regions except the Middle Atlantic division (New York, New Jersey, Pennsylvania) which fell 0.2 percent. The biggest increase was in the West South Central Division (Oklahoma, Arkansas, Texas, and Louisiana) which rose 2.1 percent. West South Central and West North Central (North Dakota, South Dakota, Minnesota, Nebraska, Iowa, Kansas, and Missouri) were the only regions to increase on a year-over-year basis.


