
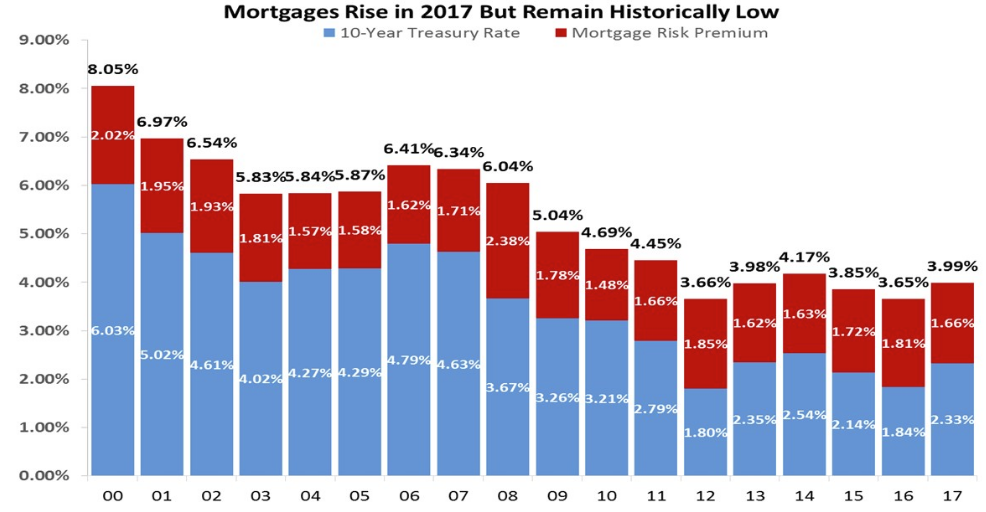
Since 2006, mortgage interest rates have fallen 242 basis points, from 6.41 percent to 3.99 percent. A decline of 246 basis points in the 10-Year Treasury Note during the same period was largely responsible for the change. However, during the first two years of this period, from 2006 to 2008, the risk premium rose by 78 basis points. Michael Neal, writing in the National Association of Home Builders (NAHB) Eye on Housing blog, says it was this premium that was targeted by federal monetary policy and those policies were partly responsible for its decline. The current risk premium, 1.66 percent, is only 4 basis points higher than it was in 2006, before that spike.
After nearly 12 years of low rates, often historically so, rates are on the move again. The Federal Housing Financing Agency's (FHFA's) data on purchase mortgages for newly constructed homes indicates there was a 7-basis point rate increase in November to 4.00 percent, still below the 4.18 percent peak recorded in February. Meanwhile, Freddie Mac posted a 2-basis point increase in its rate in November to 3.92 percent and another 3-basis point gain in December. Neal says that despite the differences, the two series track each other.
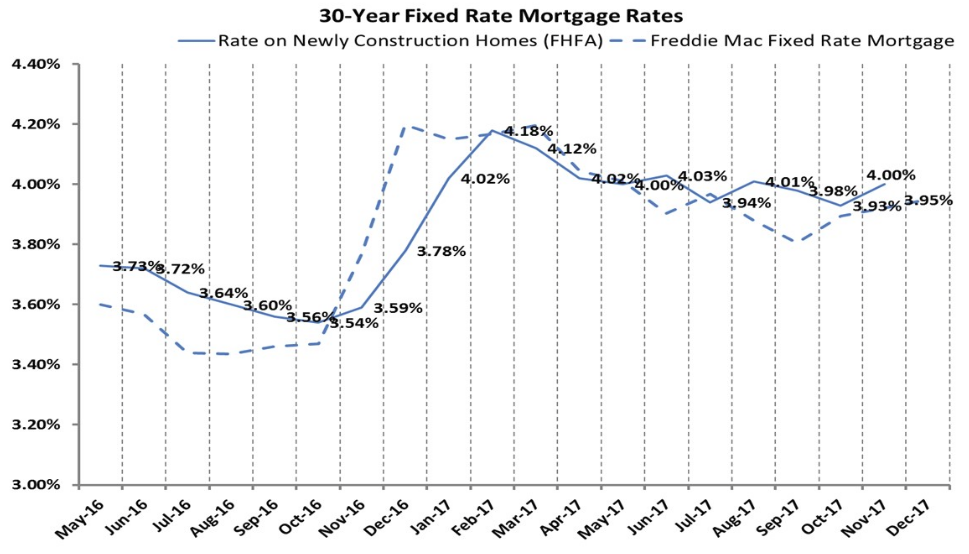
Because the FHFA series includes only new construction purchase mortgages, Neal uses the more frequently cited Primary Mortgage Market Survey from Freddie Mac to analyze the performance of rates over the course of last year. Over the 12 months, the 30-year fixed rate rose 34 basis points to 3.99 percent, ending the year under 4.0 percent for the fifth time in six years, while the 10-year Treasury Note was up by 49-basis points. As illustrated by the figure below, that difference is accounted for by a 15-basis point decline in the mortgage risk premium which started the year at 1.81 percent.
Breaking the 10-Year Treasury Note rate into its components of real return and inflation compensation, suggests that both contributed to the note's 2017 increase. Inflation compensation rose by 30 basis points to 1.87 percent while the real return, taken from the rate on the 10-Year Treasury Inflation Protected Securities (10-Year TIPS), increased by 19 basis points to 0.46 percent. However, the low 2017 rate on the 10-Year Treasury Note, when compared to the local peak rate in 2006, reflects a depressed real return. The real return in 2017 was 185 basis points below the level in 2006 while the inflation compensation component was 61 basis points lower.
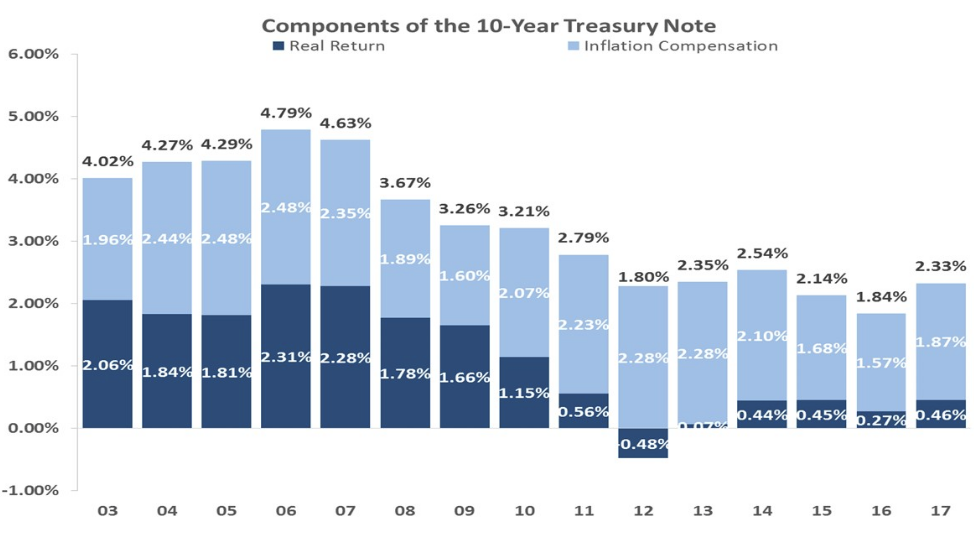
In 2012, the real return fell to negative 0.48 basis points which means investors were paying, in real terms, to lend money to the government. This rate shifted from negative to positive, Neal says, in response to the Federal Reserve's first announcement about unwinding its bond purchases; the so called "taper tantrum." Neal says his earlier analysis illustrated how, when the Fed actually did begin to normalize its balance sheet in October 2017, it was reflected by a rise in the real return on the 10-Year Treasury Note rate. "Combined, these two events beg the question whether Fed bond purchases, either actual or expected, are related to the decline in the real return over the last downturn," Neal says.
In the figure above, the real return on the 10-Year Treasury Note, with the natural log of Fed holdings of longer-dated US Treasury securities (those maturing in 5 years or more) is plotted on the left axis. The natural log is used as a proxy for the growth in Fed holdings, most likely resulting from purchases. The right-hand (secondary) axis, which plots the Fed purchase volume, is inverted so that the increase in bond-buying corresponds to a decline in the curve.
Neal said it appears that the real return on the 10-Year Note rate tracks the growth in Fed purchases of longer dated Treasury Securities between 2003 and 2012 with the tightest correlation occurring between 2008 and 2011. The 2013 normalization comments from the fed reversed the trend of the real return as expectations were priced in, even as the Fed continued to purchase. Since 2014, the real return has remained above the trend in Fed holdings of longer-dated Treasury securities, but the gap between the two has shrunk. It is possible that a third dynamic such as a recession or stronger economic growth, is responsible for both the increase in Fed purchases and the decline in the real return.


