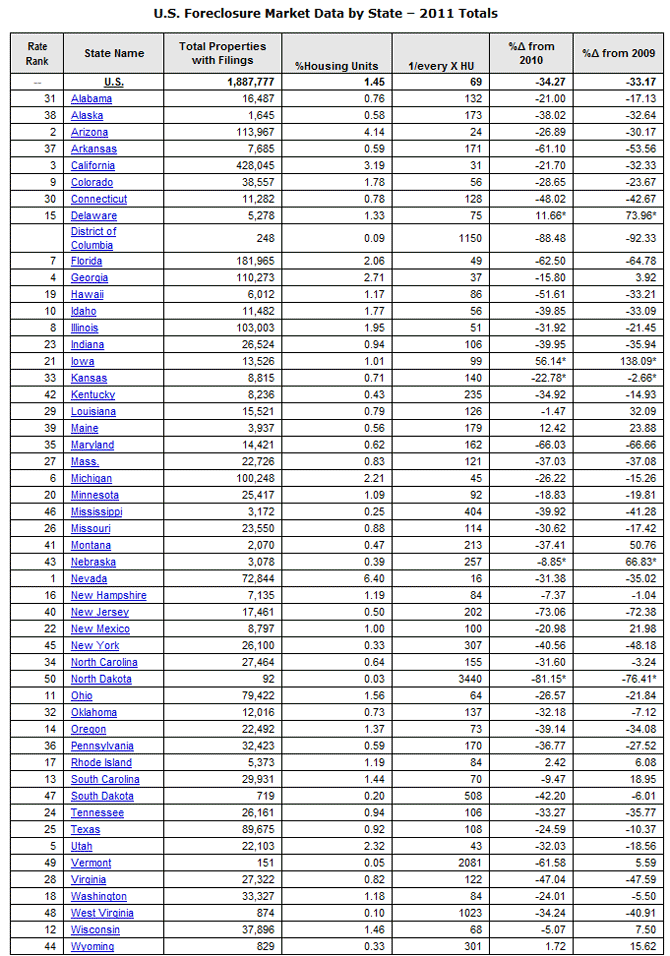
Foreclosure activity hit its lowest level in four years in 2011, decreasing by a third from the previous year according to data released today by RealtyTrac. One in every 69 housing units in the U.S. was subject to a filing during the year, 1.45 percent of the total housing stock. Activity also decreased for the month of December and for the fourth quarter of 2011 according to the U.S. Foreclosure Market Report covering the three periods which was released by the Irvine, California company this morning.
A total of 1,887,777 properties were subject to a foreclosure filing during the year. This was a decrease of 34 percent from 2010 and was 33 percent below the 2009 total and 19 percent below activity in 2008. Total U.S. foreclosure activity and the U.S. foreclosure rate in 2011 were both at their lowest annual level since 2007.
RealtyTrac, which states that its business model is to provide technology solutions and education resources to facilitate buying, selling and investing in real estate, did not attribute the declining activity to an overall improvement in the economy and housing market, but rather to flaws in the foreclosure process. Brandon Moore, chief executive officer of RealtyTrac said, "Foreclosures were in full delay mode in 2011, resulting in a dramatic drop in foreclosure activity for the year. The lack of clarity regarding many of the documentation and legal issues plaguing the foreclosure industry means that we are continuing to see a highly dysfunctional foreclosure process that is inefficiently dealing with delinquent mortgages - particularly in states with a judicial foreclosure process.
"There were strong signs in the second half of 2011 that lenders are finally beginning to push through some of the delayed foreclosures in select local markets. We expect that trend to continue this year, boosting foreclosure activity for 2012 higher than it was in 2011, though still below the peak of 2010."
RealtyTrac compiles its data by tracking documents filed in all three stages of foreclosure:
1. Notice of Default (NOD) and Lis Pendens (LIS). This is the first legal notification from a lender that the borrower on a mortgage loan has defaulted under the terms of their mortgage and the lender intends to foreclose unless the loan is brought current.
2. Auction - Notice of Trustee Sale and Notice of Foreclosure Sale (NTS and NFS): if the borrower does not catch up on their payments the lender will file a notice of sale (the lender intends to sell the property). This notice is published in local paper and contains information pertaining to the date, time and subject property address.
3. Real Estate Owned or REO properties : "REO" stands for "real estate owned" and typically refers to the inventory of real estate that banks and mortgage companies have foreclosed on and subsequently purchased through the foreclosure auction if there was no offer higher than the minimum bid.
Filings in total were also down for the fourth quarter and for the month of December while activity in the component data was mixed. During the quarter there were filings on 586,133 properties, down 4 percent from the third quarter and 27 percent from the same quarter in 2010. Default notices were down 6 percent quarter-over-quarter and 22 percent year-over year while scheduled auctions rose 4 percent for the quarter but were down 32 percent from Quarter 4, 2010. REOs were down 11 percent for the quarter and 24 percent from the same period in 2010.
Foreclosure activity hit a 49 month low in December with foreclosure filings reported on 205,024 properties during the month, one in every 222 units. This was a decrease of 9 percent from November and was 20 percent lower than one year earlier. Default notices decreased 19 percent from the previous month and were down 23 percent from December 2010; Scheduled foreclosure auctions decreased 12 percent from the previous month and were down 24 percent from December 2010; and bank repossessions (REO) increased 10 percent from the previous month but were still down 12 percent from December 2010.
The bad news dragged on for the three states that have topped the foreclosure charts almost from the beginning. While activity was down 31 percent from 2010, more than 6 percent of the housing units in Nevada (one in 16 units) had a foreclosure filing of some type during 2011. This is the fifth year that Nevada has had the highest rate of activity in the nation. Arizona registered the second highest rate for the third year in a row, with 4.14 percent of its stock (one in 24) involved in a filing.
While California dropped out of the top three states several times during the year, it still had the nation's third highest rate of activity for the year with one in every 31 housing units (3.19 percent) subject to a filing. Filings in December, however, were down 38 percent from the previous month. Other states with high levels of activity were Georgia, Utah, Michigan, and Florida.
Supporting the company's assertion that the downturn in activity is a function of dysfunction, RealtyTrac reports that foreclosures during the fourth quarter took an average of 348 days to complete, up from 336 days in the third quarter and 305 days in the fourth quarter of 2010. "The length of the average foreclosure process has increased 24 percent from 281 days in the third quarter of 2010, when lenders began to re-evaluate foreclosure procedures in earnest as the result of the so-called robo-signing controversy."
The average foreclosure process in New York has increased 37 percent during the same time period, and New York properties foreclosed in the fourth quarter took an average of 1,019 days to complete the foreclosure process - the longest of any state.


