As home sales have slowed, attention has shifted to the subject of affordability. The combination of rising home prices and higher interest rates is blamed by many as the cause of the lagging sales.
The National Association of Home Builders (NAHB) has just published a study which attempts to estimate the approximate effect of each increase in prices and each uptick in mortgage rates means in terms of how many households can afford to buy a new home. The study relies on mortgagee qualification criteria.
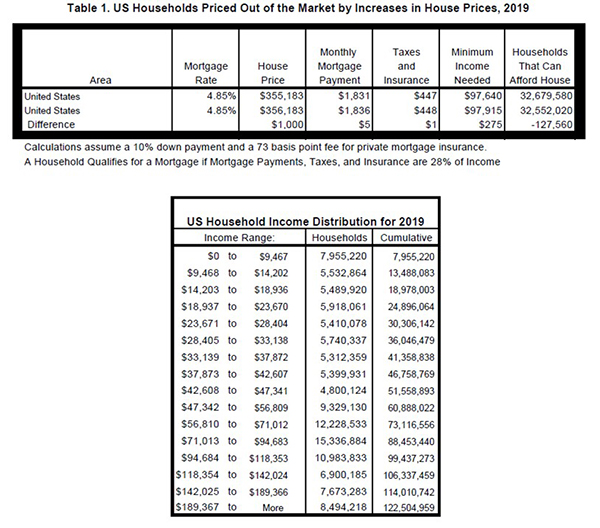
NAHB's latest estimates show that nationally, a $1,000 increase in the price of a median-priced new home (using the national figure of $355,183) will price 127,560 U.S. households out of the market. Based on their incomes and standard underwriting criteria, each of these households would be able to qualify for a mortgage to purchase the home before the price increase, but not afterward.
NAHB says a related issue is the difference between builder costs and the final price of a new home and their focus here is government regulation. They say, "When government-imposed fees, changes in regulations, or other factors increase costs for a builder or developer, the final price of the home for the buyers will usually go up by more than the increase in the costs, as related costs, such as financing and broker commissions, also rise." The Association's "priced out" estimates however seem equally applicable to the affordability of both new and existing homes.
NAHB basis its estimates on the sum of the mortgage payment including escrows. This total cannot be more than 28 percent of monthly gross household income, the standard used in underwriting conventional mortgage loans. As a result, the number of households that qualify for mortgages for a certain priced home depends on the household income distribution in an area and the mortgage interest rate at that time.
Other assumptions are a 10 percent downpayment, the monthly costs of the private mortgage insurance required with that downpayment and national rates for property taxes and homeowners' insurance. The interest rate was held constant at 4.85 percent.
Both the size of the population and the affordability of new homes influence the number of priced out households in the various states and metro areas. Among all the states, Texas registered the largest number of households priced out of the market by a $1,000 increase in the median-priced home in the state (11,152), followed by California (9,897), and Ohio (7,341). The smallest impacts were in Alaska and Wyoming where the priced-out numbers were 205 and 230 households respectively.
Among the 382 metropolitan statistical areas (MSAs) NAHB investigated the Chicago area had the largest prices out effect. There 4,499 households were squeezed out of the market by a $1,000 home price increase, both due to its large population and the relative affordability of housing compared to the large coastal metros. Around 27 percent of households can buy a new median priced home. For similar reasons, the Houston MSA where nearly 33 percent of households can afford median-priced new homes.to begin with, registered the second largest number of priced out households (3,546). In New York-Newark-Jersey City 3,531 households would be affected. Compared to Chicago or Houston, the median-priced new home is affordable to a smaller share of the households in New York, but New York is the largest metro area by population size with over 7 million households.
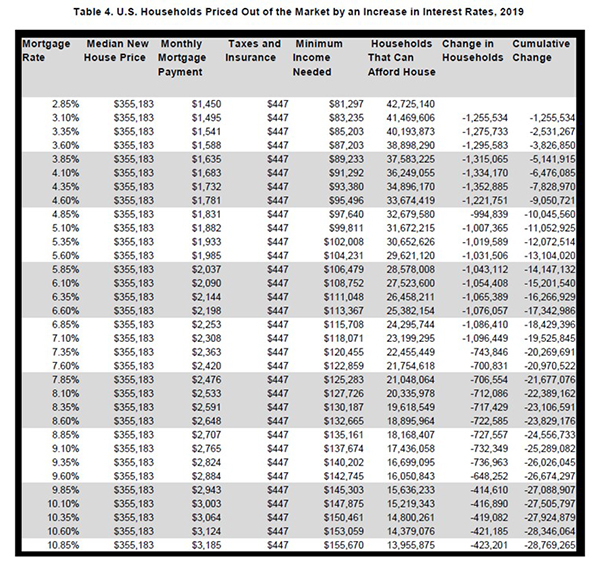
Taken alone, interest rates have a similar impact. NAHB estimates that every quarter point increase in rates eliminates the homebuying ability of one million households. The impact however is felt more strongly when rates are low. For example, an increase from 2.85 percent to 3.10 percent would affect around 1.26 million households, while an increase from 10.6 percent to 10.85 percent would mean about 423,000 households would be squeezed out of the market. These diminishing effects happen because only a few households at the thinner end of household income distribution will be affected while at the low end a 25 basis-point increase would hit at the thicker part of income distribution.