
The U.S. Census Bureau and the Department of Housing and Urban Development have jointly released NEW RESIDENTIAL SALES for October 2010.
The survey is primarily based on a sample of houses selected from building permits. Since a "sale" is defined as a deposit taken or sales agreement signed, this can occur prior to a permit being issued. Changes in sales price data reflect changes in the distribution of houses by region, size, etc., as well as changes in the prices of houses with identical characteristics. It takes four months to establish a trend of new home purchases.
Despite the expectation that the absence of a Homebuyer Tax Credit would lead to slow sales, analysts expected home sales to rise to 310,000 in October, which would have constituted a marginal increase from Septembers rate of 308,000.
Reuters Quick Recap...
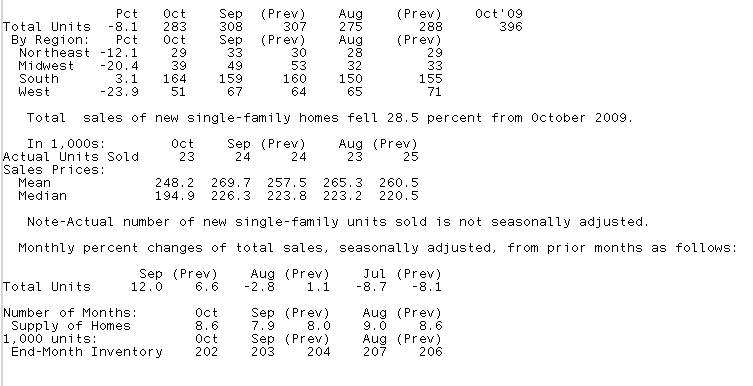
RTRS-US OCT SINGLE-FAMILY HOME SALES 283,000 UNIT ANN. RATE (CONS 310,000) VS SEPT 308,000 (PREV 307,000)
RTRS-US OCT SINGLE-FAMILY HOME SALES -8.1 PCT VS SEPT +12.0 PCT (PREV +6.6 PCT)
RTRS-US OCT HOME SALES NORTHEAST -12.1 PCT, MIDWEST -20.4 PCT, SOUTH +3.1 PCT, WEST -23.9 PCT
RTRS-US OCT NEW HOME SUPPLY 8.6 MONTHS' WORTH AT CURRENT PACE VS SEPT 7.9 MONTHS
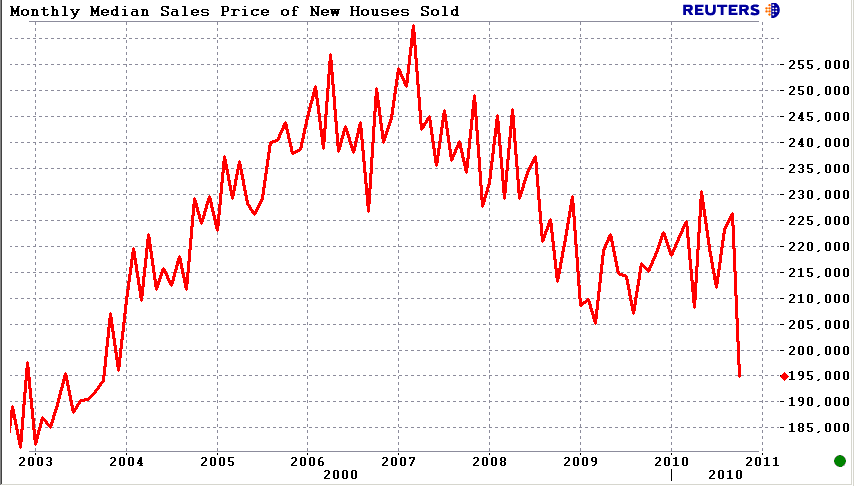
RTRS-US OCT MEDIAN SALE PRICE $194,900, LOWEST SINCE OCT 2003, -9.4 PCT FROM OCT 2009 ($215,100)
RTRS-US HOMES FOR SALE AT END OF OCT 202,000 UNITS, LOWEST SINCE JUNE 1968, VS SEPT 203,000 UNITS
RTRS-TABLE-U.S. Oct single-family home sales fell 8.1 pct
Excerpts from the release....
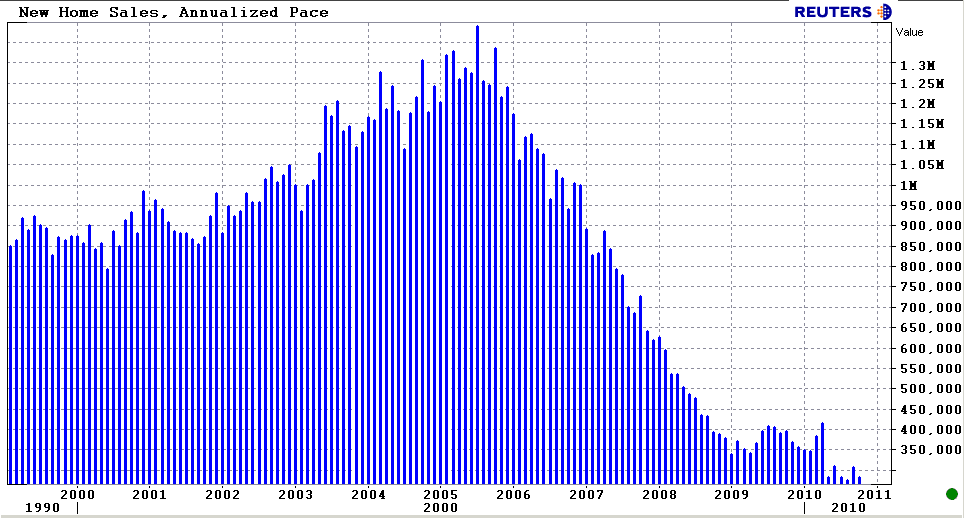
Sales of new single-family houses in October 2010 were at a seasonally adjusted annual rate of 283,000, according to estimates released jointly today by the U.S. Census Bureau and the Department of Housing and Urban Development. This is 8.1 percent (±16.1%) below the revised September rate of 308,000 and is 28.5 percent (±12.6%) below the October 2009 estimate of 396,000.
The seasonally adjusted estimate of new houses for sale at the end of October was 202,000. This represents a supply of 8.6 months at the current sales rate.
The median sales price of new houses sold in October 2010 was $194,900; the average sales price was $248,200.
Yes, you're seeing that correctly. Median prices of new homes sold fell to their lowest level since 2003! This after showing slow and steady progress off the lows of early 2009.
The housing market, purchases specifically, is stagnant near record low levels of activity. This can make for large relative swings in month to month data. The one positive we see is new homes inventory is near a record low so it won't be hard to knock inventory down quickly when demand picks up. The decline in home prices was a bit startling but then again we're dealing with foreclosure moratoriums and the expectation that shadow inventory will eventually push home prices even lower. Maybe we're already seeing that play out in the housing market. Qualified buyers are in control....
READ MORE ABOUT SHADOW INVENTORY AND HOME PRICES


