
American homeowners got $20,000 richer in the second quarter just sitting in their family room. Black Knight’s newest Mortgage Monitor says that was the average gain in borrower equity during the quarter as home prices continued to soar.
Tappable equity, the amount available to homeowners before reaching a maximum 80 percent combined loan-to-value (CLTV) ratio, hit a record high total of $9.1 trillion, a $1 trillion increase in a single quarter. The average mortgage holder saw his/her tappable equity grow by $20,000 during that period to a total of $173,000.
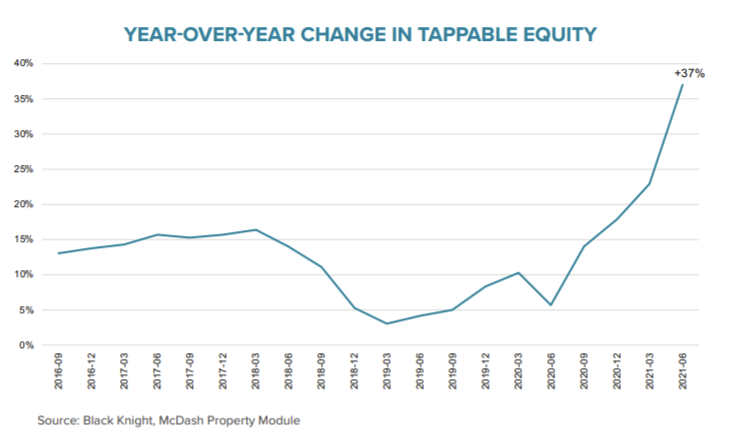
The weighted average CLTV for the mortgage market is now 46 percent, the lowest leverage on record. Fewer than 3 percent of mortgaged homeowners have less than 10 percent equity and only 0.6 percent are underwater, both record low figures.
The equity growth is also good news both for homeowners who were financially impacted by COVID-19 as well as their lenders. Of those borrowers (an estimated 1.75 million) who were in forbearance plans in mid-August, at least 98 percent had 10 percent equity or more in their home. Black Knight says this is a drastically different dynamic than during the worst of the Great Recession, when more than 40 percent of all mortgage holders had less than 10 percent equity and 28 percent were fully underwater
Even when deferred principal, interest, taxes, and insurance payments, potentially as much as 18 months’ worth, are added into their debt, only 7 percent of forborne borrowers (130 ,000), fall below a 10 percent equity position. FHA and VA borrowers account for 90,000 of them.

Black Knight Data & Analytics President Ben Graboske says, “Such strong equity positions should help limit the volume of distressed inflow into the real estate market as well as provide strong incentive for homeowners to return to making mortgage payments – even if needing to be reduced through modification.”
And speaking of forbearance, Black Knight says that 97 percent of borrowers who left their plans in 2020 have either resumed their payments (64 percent) or have paid off their mortgages through refinancing or selling their homes.
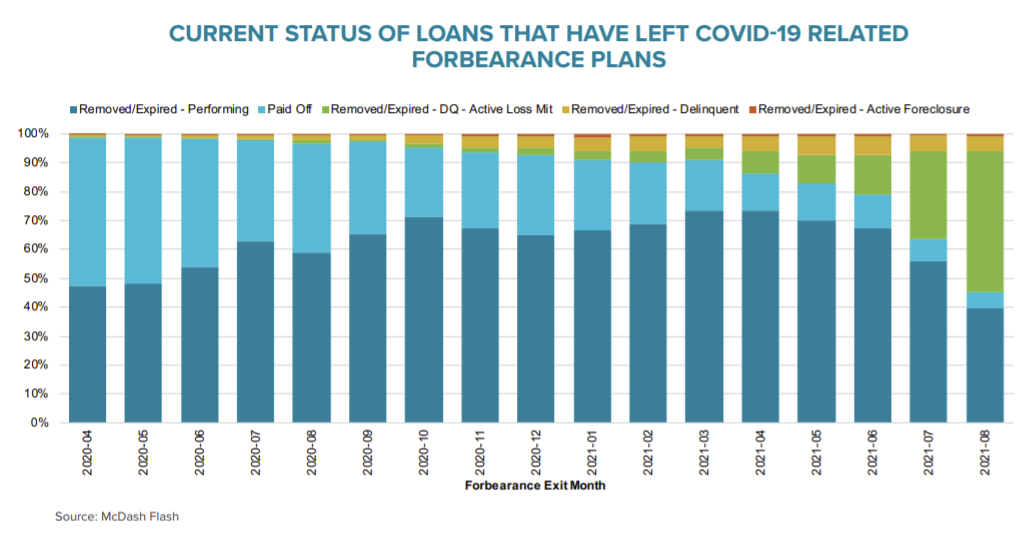
However, performance has shifted noticeably among more recent plan exits. One-third of borrowers who've left plans over the past 45 days remain in post-forbearance loss mitigation with their servicers, although this is to be expected given the time needed by servicers to work through post-forbearance waterfalls with borrowers. No more than 7 percent of borrowers who exited in any given month are delinquent or in active foreclosure who are not also in loss mitigation.
Black Knight says a close eye on the performance of more recent exits is warranted as it stands to reason that those who stayed in forbearance longer may have been more financially impacted by the pandemic and at a higher risk of post-forbearance default.
Returning to the sizable equity gains, Black Knight says it appears that homeowners are becoming more willing to tap into that paper wealth with cash out refinancing. Given that interest rates are expected to rise, it is likely to play a larger part in the overall refinance market.
Despite a 5 percent decline from the previous quarter, Q2 marked the fourth consecutive quarter with over $1 trillion in total mortgage lending. Purchase originations totaled $440 billion, the largest quarterly number on record. It was also the 5th consecutive quarter with at least 2.2 refinances. More than 1.1 million of them were cash-out, the largest volume in 15 years and more than $63 billion in equity was withdrawn, the most since mid-2007.
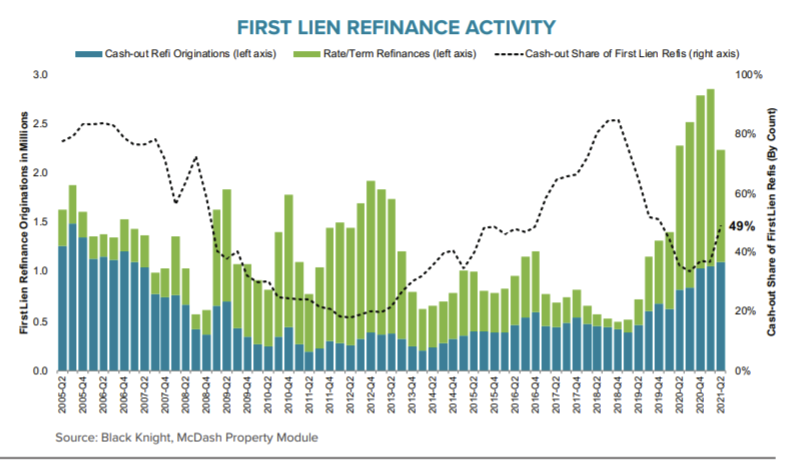
Black Knight says some expected shifts are beginning to happen. The refi share of lending fell to 58 percent in the second quarter and the cash-out share rose sharply from 37 percent in Q1 to 49 percent. The company calls this “typical behavior” when rates start to rise and warns that, while the equity withdrawn is still conservative relative to the available levels, lenders and servicers should be taking note of this ongoing trend and adjusting product and retention strategies accordingly.
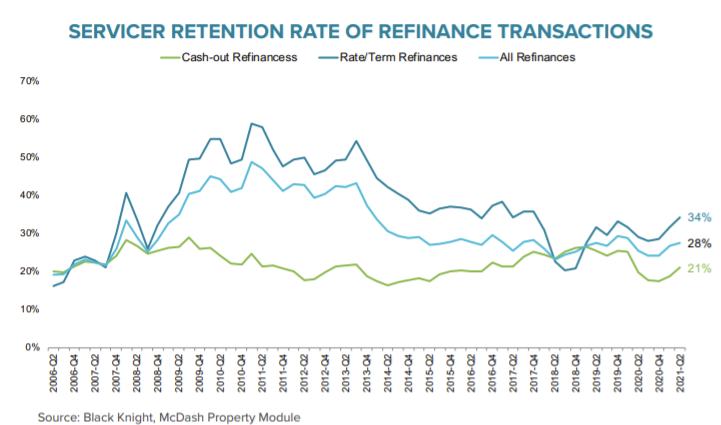
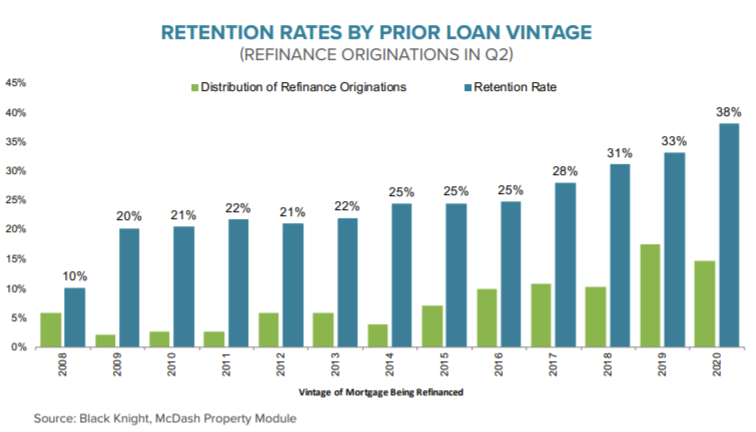
While the number of refinances was down in the second quarter, servicers did improve their record of holding on to borrowers, retaining 28 percent of all those who refinanced during the quarter, the largest share since the onset of the pandemic. Servicers kept the loans of 34 percent of rate/term refinances and 21 percent of those borrower taking cash out. The rate/term retention rate was the highest since 2017 and the cash-out rate was up from 18 percent in the last half of 2020.
Servicers were noticeably more successful in retaining borrowers refinancing out of 2019-2020 vintage mortgages compared to other vintages at 38 percent, likely due to having a recent lending relationship with those borrowers. Those two years represented nearly one-third of all refis, with 2019 alone accounting for 20 percent, a time when 30-year rates had spiked and were considerably higher than they are today.
Bank servicers had retained a much lower share of refinances during the early months of the pandemic. Their retention rate slipped from 24 percent in Q4 2019 to 16 percent at the end of 2020. This was due in part to banks shying away from the market due to rising delinquencies and economic uncertainty. At the same time, retention rates among portfolio held mortgages – largely driven by banks originating jumbo loans – fell from 37 percent to 22 percent. Both segments rebounded in the first half of 2021, with retention rates among bank servicers rising to 22 percent and portfolio retentions growing to 30 percent, suggesting bank servicers are re-entering the market with a focus on retaining their refinancing borrowers.
Overall, nonbanks have been much more successful at retaining refinancing borrowers since early 2017, with retention rates a full 11 points higher than banks in Q2
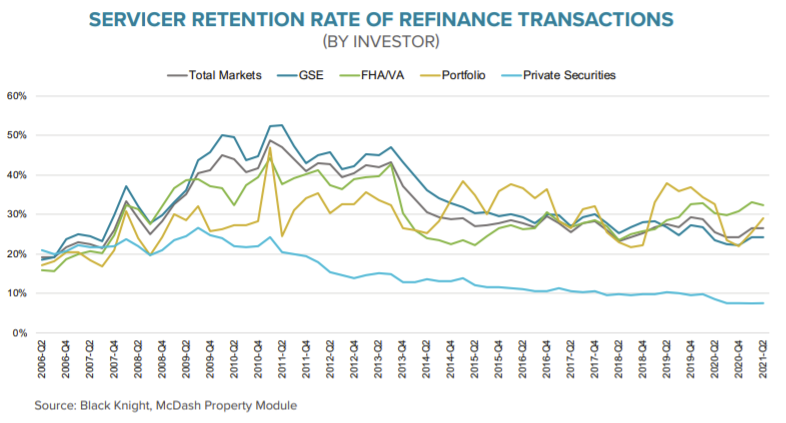
From an investor perspective, FHA/VA loans are seeing the highest retention rates with one-third of borrowers who refinance those mortgages being retained by their servicer. The improvement in portfolio retentions noted above puts those servicers in second place.


