
Home prices in much of the nation increased in May according to the S&P/Case Shiller Home Prices Indices (HPI) released on Tuesday. May was the second straight month when both the 10 and 20-City composite indices increased. When compared to May 2010, however, only one Metropolitan Statistical Area (MSA), Washington DC, reported an annual increase and that was a modest 1.3 percent.
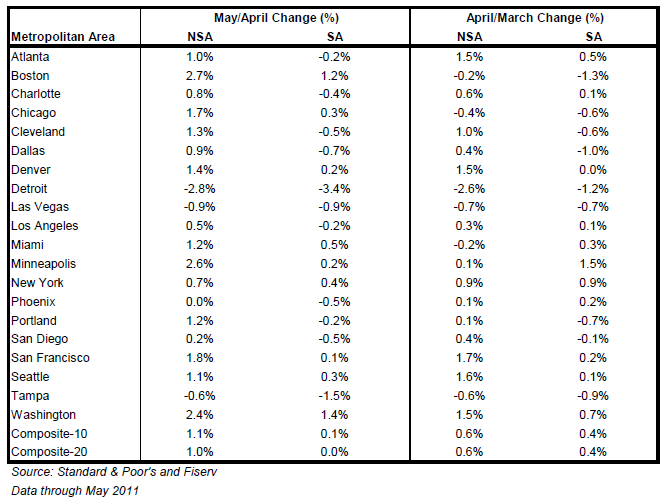
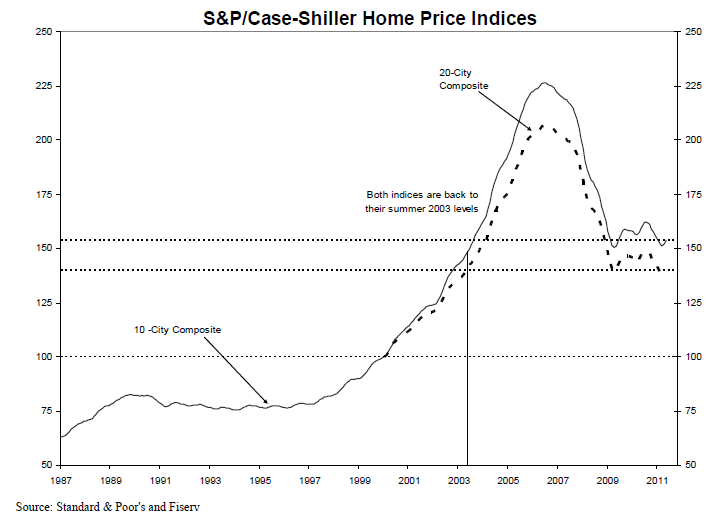
On a non-seasonally adjusted basis, the 10-City Composite increased 1.1 percent in May and the 20-City was up 1.0 percent. This was on top of respective 0.8 percent and 0.7 percent increase in April over March. In addition, 16 of the 20 MSAs in the larger composite posted positive numbers with only Detroit, Las Vegas, and Tampa declining and Phoenix unchanged. The current value of the 10-City Composite is 153.64 and the 20-City is 139.87.
On a seasonally adjusted basis there was no change in the 20-City Composite and a mere 0.1 percent increase in the 10 City Composite. S&P recommends using non-seasonally adjusted data, calling it the "more reliable indicator".
Despite the monthly increases, the 10-City Composite recorded a year over year price decline of 3.6 percent and the 20-City was down 4.5 percent since May 2010. In the case of some MSAs these annual declines were significant. Minneapolis dropped 11.7 percent, Tampa and Phoenix each lost 9.5 percent, Detroit 9.3 percent and Portland (OR) 9.1 percent. In addition, both Composites and 11 of the constituent MSAs had a larger percent annual drop in May than they had in April.
"We see some seasonal improvements with May's data," David M. Blitzer, chairman of the Index Committee at S&P Indices said. "This is a seasonal period of stronger demand for houses, so monthly price increases are to be expected and were seen in 16 of the 20 cities. The exceptions where prices fell were Detroit, Las Vegas, and Tampa. However, 19 or 20 cities saw prices drop over the last 12 months. The concern is that much of the monthly gains are only seasonal.
Blitzer echoes the concerns expressed yesterday in Fannie Mae's Economic and Mortgage Market Analysis for July which attributed a rise in median home prices in non-distressed areas to a lower market share of short sales and foreclosures but predicted this was a seasonal occurrence and that there would be further deterioration of home prices at summer's end.
Blizer said that May's report showed unusually large revisions in some of the MSAs. "In particular, Detroit, New York, Tampa, and Washington DC all saw above normal revisions. Our sales pairs data indicate that these markets reported a lot more sales from prior months, which causes the revisions. The lag in reporting home sales in these markets has increased over the past few months. Also when sales volumes are relatively low, as is the case right now, revisions are more noticeable."
Despite the continuing gloom, average home prices in the U.S. are back to the levels they reached in the summer of 2003. Measuring from peak pricing levels in June/July 2006 to the present time, prices in the 10-City Composite are down 32.1 percent and in the 20 city 32.3 percent. When the composite cities hit their respective price bottoms, the peak to trough declines were 33.5 percent for the 10-City (April 2009) and 33.3 percent for the 20-City (March 2011.)
READ MORE...
The Million Dollar Question: Have Home Prices Bottomed?
ABOUT: The HPI are published monthly. They combine matched price pairs for thousands of individual houses based on available arms-length sales data. The indices had a value of 100 in January 2000 so a current value of 150 would indicate a price appreciation of 50 percent since January 2000 for a typical home in the subject market.


