
Sales of newly constructed homes lost momentum in April, reversing three straight months of gains. The Census Bureau and the Department of Housing and Urban Development said sales were down 11.4 percent from March to a seasonally adjusted annual rate of 569,000, and barely eked out an 0.5 percent gain from the April 2016 estimate of 566,000 units.
There was one positive note. Sales in March were revised upward significantly; from 621,000 to 642,000. The pushed March ahead of last July, to being the strongest month since the housing crisis began.
Analysts had expected sales to dip after three months of solid increases, however those polled by Econoday were looking for them to be in a range of 585,000 to 622,000 units. The consensus was 604,000 units.
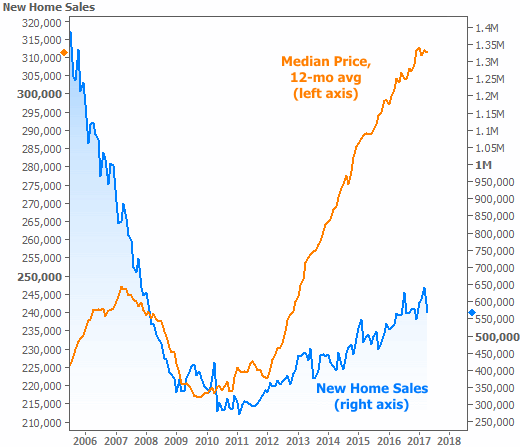
On a non-seasonally adjusted basis there were 54,000 newly constructed homes sold compared to 61,000 in March and 55,000 in April 2016. Prices, both median and average, of homes sold during the month were lower than the previous April. The median slipped from $321,300 to $309,200 and the average declined to $368,300 from $380,000. It was the second time in three months that sales prices were lower on a year-over-year basis.
At the end of the reporting period there were an estimated 264,000 new homes for sale nationwide, a 3,000-unit increase from March. The available inventory was estimated at a 4.8-month supply at the current sales pace, compared to 4.3 months in March. Inventory numbers are not seasonally adjusted. The average marketing period in April was 3.7 months.
Sales in the Northeast were down 7.5 percent from March and 5.1 percent compared to April 2016. The Midwest saw sales decline by 13.1 percent for the month, but were 19.7 percent higher than a year earlier
In the South, month-over-month sales were down by 4.0 percent, but sales rose 4.1 percent from the previous April. The West took the biggest hit, down 26.3 percent and 13.7 percent for the two periods.


