
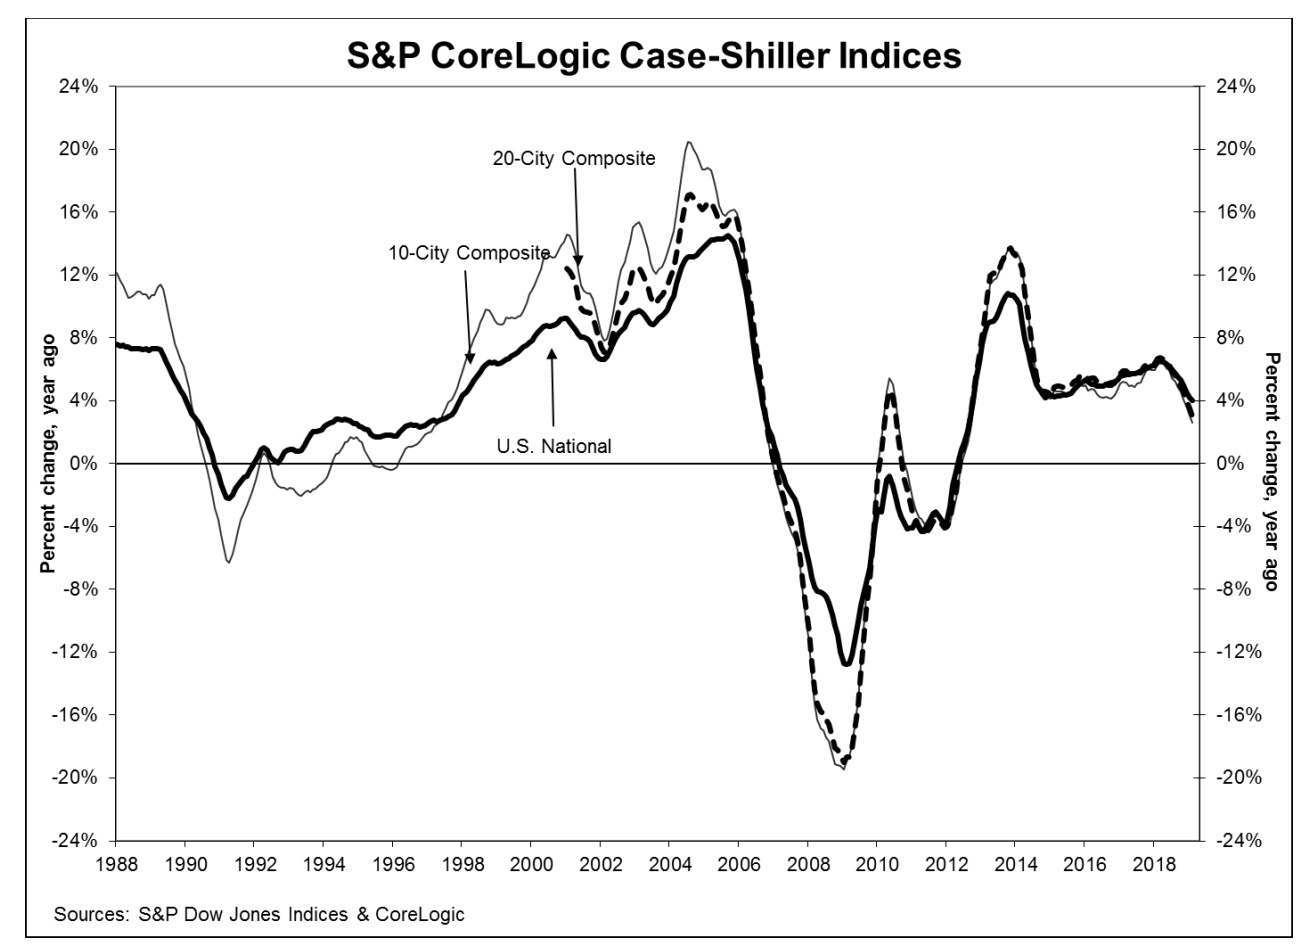
The S&P CoreLogic Case-Shiller Indices for February continue to show a slowdown in home price gains on a year-over-year basis although all of the monthly changes were higher than in January. The U.S. National Home Price Index, covering all nine U.S. census divisions, reported a 4.0% annual gain in February, down from 4.2% in the previous month. The index was up 0.2 percent in February before seasonal (NSA) adjustment and 0.3 percent afterward (SA). The prior month prices were up 0.2 percent seasonally adjusted but lost 0.2 percent on an NSA basis.
On the 10-City Composite the annual appreciation rate was 2.6%, down from 3.1% in January. The 20-City Composite annual rate was 3.0 percent compared to 3.5 percent the previous month. Both composites were up 0.2 percent both SA and NSA while both had posted negative changes on an NSA basis in January. Fourteen of the 20 cities reported price gains before seasonal adjustment, while 17 of 20 cities reported such changes after seasonal adjustment.
Las Vegas and Phoenix held on to the top positions among the 20 cities with annual increases of 9.7 percent and 6.7 percent respectively. The third-place honors switched hands again with Tampa posting a 5.4 percent increase. Minneapolis had been the third fastest appreciating city in January and Atlanta in December. Only one of the 20 cities reported greater price increases in the year ending February 2019 versus the year ending January 2019.
"The pace of increases for home prices continues to slow," says David M. Blitzer, Managing Director and Chairman of the Index Committee at S&P Dow Jones Indices. "Homes began their climb in 2012 and accelerated until late 2013 when annual increases reached double digits. Subsequently, increases slowed until now when the National Index is up 4 percent in the last 12 months. Sales of existing single-family homes have recovered since 2010 and reached their peak one year ago in February 2018. Home sales drifted down over the last year except for a one-month pop in February 2019. Sales of new homes, housing starts, and residential investment had similar weak trajectories over the last year. Mortgage rates are down one-half to three-quarters of a percentage point since late 2018.
"The largest year-over-year price increase is 9.7 percent in Las Vegas; last year, the largest gain was 12.7 percent in Seattle. Regional patterns are shifting. The three California cities of Los Angeles, San Francisco and San Diego have the three slowest price increases over the last year. Chicago, New York and Cleveland saw only slightly larger price increases than California. Prices generally rose faster in inland cities than on either the coasts or the Great Lakes. Aside from Las Vegas, Phoenix, and Tampa, which saw the fastest gains, Atlanta, Denver, and Minneapolis all saw prices rise more than 4 percent -- twice the rate of inflation."
The National Index is now 11.1 percent higher than at its previous peak in July 2006 and has increased by 53.0 percent from the recession low in February 2012. The 20-City Composite is 3.0 percent above its previous peak, but the 10-City, after setting a new high a few months ago is now even with its pre-crisis high. As of February 2019, average home prices for the MSAs within the 10-City and 20-City Composites are back to their winter 2007 levels.
The S&P CoreLogic Case-Shiller Home Price Indices are constructed to accurately track the price path of typical single-family home pairs for thousands of individual houses from the available universe of arms-length sales data. The National U.S. Home Price Index tracks the value of single-family housing within the United States. The indices have a base value of 100 in January 2000; thus, for example, a current index value of 150 translates to a 50 percent appreciation rate since January 2000 for a typical home located within the subject market.
As of February 2019, the National Index was at 205.04, up from 204.71 in January. The 10- and 20-City Composites had readings of 226.20 and 212.70 respectively, compared to 226.93 and 212.41 the prior month. Los Angeles has the highest index at 280.58 and Cleveland the lowest at 121.24.


