Black Knight's Mortgage Monitor for the month of October looks at current delinquency statistics and their potential downstream effects on inventory and other housing concerns. The report seems to confirm that homeowners, even those who sought forbearance protection during the COVID-19 pandemic, seem to be performing well on their mortgage loans.
The national mortgage delinquency rate was at 3.74 percent in October, down from a pandemic peak of over 8 percent in April 2020. While there are still almost 700,000 more serious delinquencies, borrowers more than 90 days past due, than before the onset of the pandemic, those numbers fell by 127,000 or 10 percent during October as the first wave of forborne homeowners reached the end of eligibility and returned to making payments. Black Knight says further improvement is expected in coming weeks as borrowers work through loss mitigation options as they exit the program.
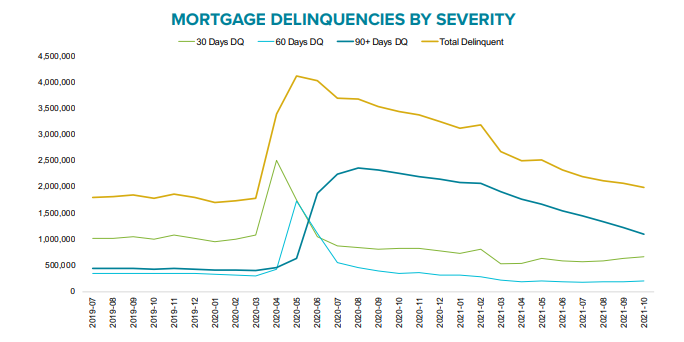
The number of mortgages transitioning from current to 30 days past due rose 9.0 percent compared to September, trending close to pre-pandemic levels, but were down 6 percent from the roll-over rate in October 2019. The company says each month in the current year has seen lower transitions that in 2019 and may ultimately see the lowest inflow of new delinquencies in more than 15 years.
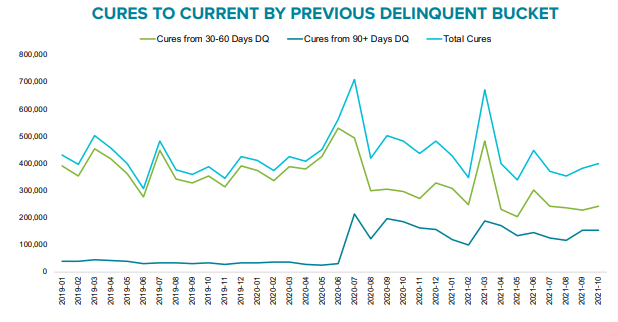
The number of loans becoming seriously delinquent during the month was down 4 percent from the same month in 2019, but the year has seen 12 percent more serious delinquencies than two years earlier as loans have remained seriously delinquent longer, in part because of forbearance and probably the foreclosure moratoriums. At the same time, October saw the highest level of delinquent loans becoming current, a trend likely to continue, as servicers work through a backlog of homeowners exiting forbearance.
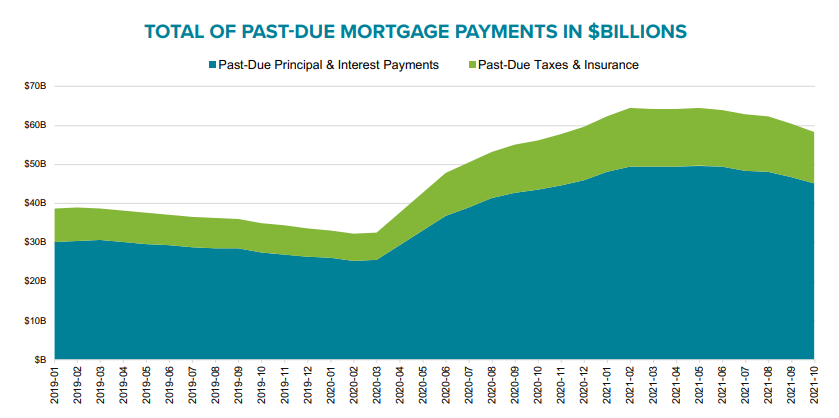
As delinquencies have subsided so has the balance of past due mortgage payments. Those deficits, including past due principal, interest, taxes, and insurance payments, soared from around $35 billion pre-pandemic to a peak of more than $64 billion. That has now pulled back to $58 billion. About $26 billion of this debt is COVID-19 related, including $19.8 billion in principal and interest and $6.2 billion in past due taxes and insurance premiums.
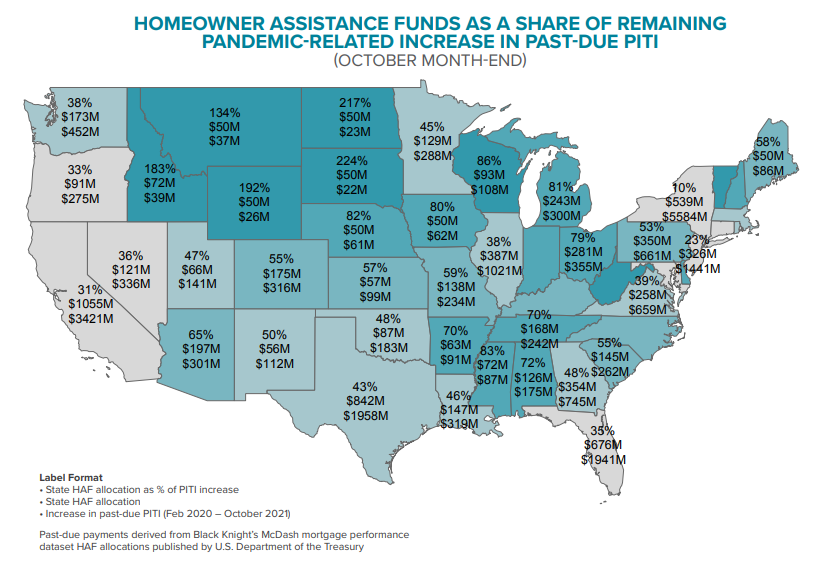
The company says states have significant assistance remaining under the American Rescue Plan Act to assist delinquent homeowners, assuming that 100 percent of that $9.4 billion was directed at paying down the forbearance related debt. How much this would help varies by location. Seven states (primarily in the upper Midwest) and Puerto Rico could retire this debt. In other places such as New York and Hawaii, the coverage could be as low as 10 percent.
The number of homeowners remaining in forbearance continues to decline and by mid-November was down to just over 1 million or 1.9 percent of active mortgages. Each of the major portfolios being serviced has under 400,000 loans remaining in the program, but percentages vary from 1.2 percent of GSE (Fannie Mae and Freddie Mac) loans and 2.4 percent of loans serviced for bank portfolios and private label securities (PLS), to 3.1 percent of those backed by FHA and the VA.
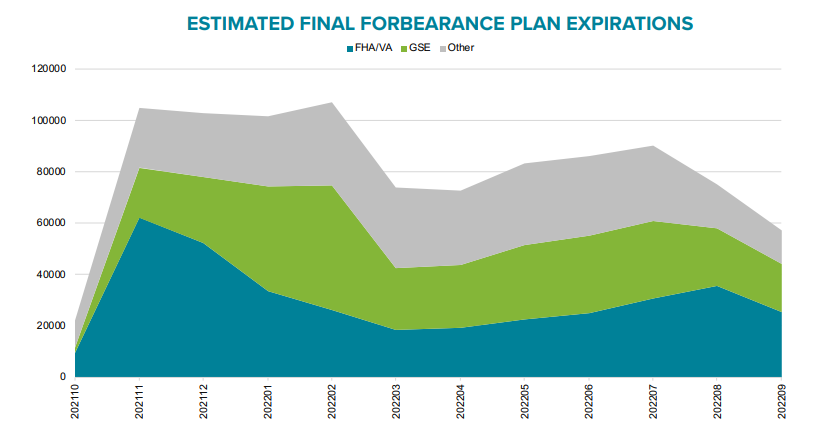
Approximately one third of forborne FHA and VA loans will reach their final expirations by the end of the year along with 15 percent of GSE and 20 percent of active portfolio and PLS plans. The company says servicers are still working through a backlog of recent expirations and will confront another 100,000 per month as they head into the first quarter of next year.
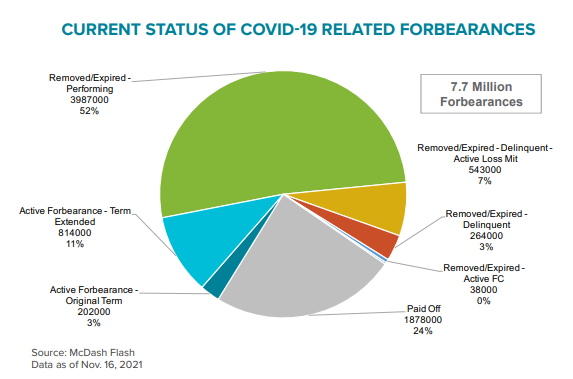
Of the 7.7 million who entered forbearance during the pandemic, about 1.02 million homeowners remain in the program. Fifty-two percent, nearly 4 million, have exited and have loans that are performing while over a half million have exited and are delinquent but undergoing loss mitigation and nearly 1.9 million have paid off their loans. Only 38,000, less than 1 percent of participants are in foreclosure. Black Knight says the number of loans in post-mitigation has increased by 48 percent over the last 60 days, indicating that the foreclosure numbers may increase.
Overall, it appears that homeowners will be making a softer landing from the financial impacts of the pandemic than was expected and, while there still will be homes coming on the market because of its impact, they will not boost inventories of homes for sale to the extent that some, such as National Association of Realtors economist Lawrence Yun, have predicted.
The Monitor says "if meaningful inflow [of available homes] isn't seen from the post-forbearance population, it could signal a longer-term recovery for inventory levels across the country, which could mean elevated home price growth rates as tightening affordability butts up against a continued shortage of supply."
For-sale inventories had begun to grow earlier this year, promising relief from the 25 percent deficit earlier in the year, but the improvement has now leveled off and the market faces a 54 percent deficit in properties for sale compared to 2017 to 2019 averages. The number of new listings in October was down only 2 percent year-over-year but more than 12 percent below the average for a pre-pandemic October.
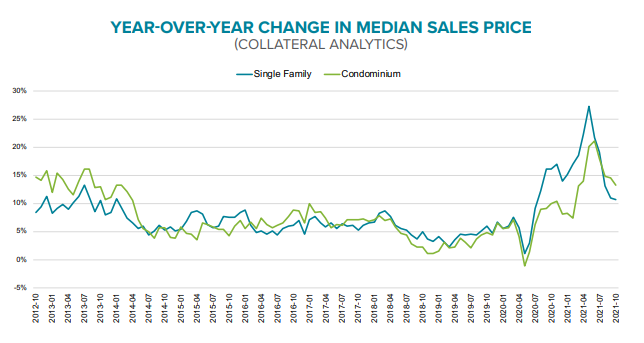
Home price growth has begun to slow, the Black Knight Home Price Index (HPI) showed deceleration in annual appreciation in August, September, and October and annual single-family home price growth was down to 11 percent entering November. The month-over-month increase of 0.6 percent in October was the smallest in 10 months but still three times the 10-year average growth for the month. The shortage of inventory continues to put upward pressure on prices and raises affordability concerns, especially as interest rates increase. Shrinking numbers of condominiums are also pushing prices higher and Black Knight says cost appreciation there is now outpacing that of single-family homes after lagging them significantly earlier in the year.
The dual increases - home prices and interest rates - have now pushed the monthly out-of-pocket mortgage payment required to buy an average-priced home to $1,346, assuming a 20 percent down, 30-year fixed-rate mortgage. This is an increase of nearly 24 percent ($260) since the start of the year and is approaching the 2006 peak of $1,372.
It now takes 22.4 percent of the median household income to make the monthly mortgage payment on a median-priced home, up from 18.1 percent at the beginning of the year. This is the largest share since late 2018 when 30-year interest rates were near 5.0 percent but is still far lower than the 34 percent payment-to-income ratio in 2006.
Black Knight says history shows a slowdown in home price growth typically begins when the payment/income ratio exceeds 20.5 percent, but the current imbalance in supply and demand may upset that paradigm.
While affordability is a growing concern, those price increases have also continued to add to homeowners record levels of tappable equity, the amount available for homeowners to access while retaining at least 20 percent equity in their homes. That equity soared by an aggregate of $254 billion in the third quarter of 2021 to $9.4 trillion.
Ben Graboske, president of Black Knight's Data & Analytics division, says this total is up 32 percent from the same time last year and nearly 90 percent higher than the peak before the housing crash. "As prices have surged over the past 18 months, the average mortgage holder's equity stake has risen by $53,000. That works out to nearly $178,000 available in tappable equity to the average homeowner with a mortgage," he said.
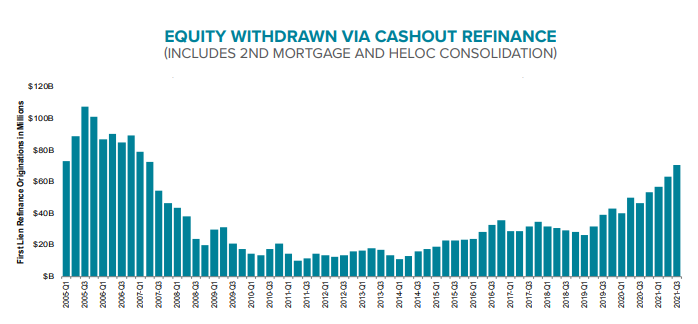
Homeowners are apparently well aware of this windfall. The company says borrowers used cash-out refinancing and home equity lines to draw down $70 billion of that equity during the third quarter, the fastest pace in 14 years. It adds, however, that we shouldn't necessarily go down the "using your home as an ATM" road of concern before considering that the amount is equivalent to only 0.8 percent of available equity, less than one-third of the cash-out activity in 2005.
Black Knight also reminds that underwriting standards are much higher than before the crash with average credit scores 50 points higher and loan-to-value ratios much lower. In fact, the average borrower's mortgage debt is now just 45.2 percent of their home's value - the lowest total market leverage the company has ever recorded, going back to at least the turn of the century.