The numbers on home price trends for March from the Federal Housing Finance Agency (FHFA) were somewhat less aggressive that those also released on Tuesday from S&P Dow-Jones Case-Shiller indices. While it is like comparing apples to eggplants it is still interesting to see the variations. FHFA's seasonally adjusted monthly Home Price Index (HPI) for March posted an 0.3 percent gain over February, much weaker than the 0.8 percent increases for the Case-Shiller National Index and 10-City Composite and 0.9 percent for its 20-City Composite. The FHFA number was also below analyst expectations of 0.7 percent.
FHFA said that its quarterly HPI increased by 1.32 percent during the first three months of 2015, the 15th consecutive quarterly price increase in its purchase-only seasonally adjusted index. Annualized this is an increase of 5.29 percent.
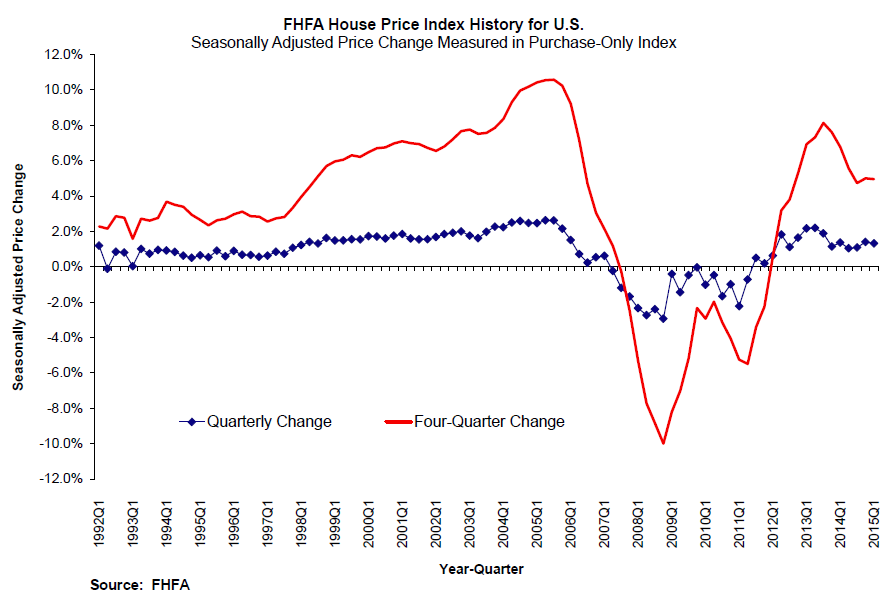
"The first quarter saw strong and widespread home price growth throughout most of the country," said FHFA Principal Economist Andrew Leventis. "Home prices are now, on average, roughly 20 percent above where they were three years ago. This run-up has been historically exceptional and is particularly notable in light of the limited household income growth and modest rate of overall inflation observed during that same time period."
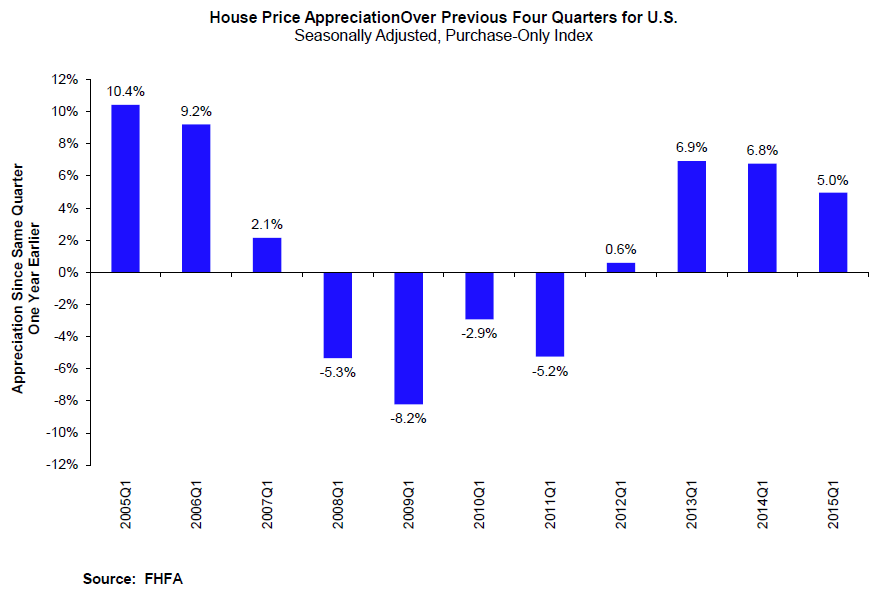
The seasonally adjusted, purchase-only HPI rose 5.0 percent from the first quarter of 2014 to the first quarter of 2015 while prices of other goods and services fell 1.5 percent. The inflation-adjusted price of homes thus rose approximately 6.5 percent over the latest year.
Home prices rose in 48 states between the first quarter of 2014 and 2015. The biggest gainers were Colorado, up 11.2 percent, Nevada, 10.1 percent; Florida, 8.7 percent; Washington, 76 percent; and California, 7.5 percent.
Of the nine census divisions, the Mountain division experienced the strongest increase in the first quarter, posting a 2.6 percent quarterly increase and a 6.8 percent increase since last year. House price appreciation was weakest in the West North Central division, where prices rose 0.7 percent.
All nine divisions posted positive gains on a year-over-year basis with the largest again in the Mountain region at 7.2 percent and the smallest, 2.7 percent, in New England.
FHFA's HPI tracks changes in average home prices by analyzing changes in home values for the individual properties based on sales price information from mortgages purchase or guaranteed by Fannie Mae and Freddie Mac over the last 40 years. More than seven million repeat sales transactions are used in the estimation of the purchase-only HPI.